Github API to understand user Contribution
%load_ext autoreload
%autoreload 2

import datetime
import logging
import os

# Initialize logger.
logging.basicConfig(level=logging.INFO)
_LOG = logging.getLogger(__name__)
import github_utilsGithub API to understand user Contribution
These numbers come straight from the upstream repo via the REST API, so they only include commits and PRs where you’re the author or the committer on that repo. They do not pick up any work you did in a fork (or the individual commits squashed into a single merge), which is why they’ll always undercount what GitHub Insights shows for your overall contributions.
!sudo /bin/bash -c "(source /venv/bin/activate; pip install --quiet jupyterlab-vim PyGithub)"
!jupyter labextension enable
Authenticate GitHub Client
# Set your GitHub access token.
os.environ["GITHUB_ACCESS_TOKEN"] = ""
access_token = os.getenv("GITHUB_ACCESS_TOKEN")
if not access_token:
_LOG.error("GITHUB_ACCESS_TOKEN not set. Exiting.")
raise ValueError("Set GITHUB_ACCESS_TOKEN environment variable")
client = github_utils.GitHubAPI(access_token=access_token).get_client()users = github_utils.get_contributors_for_repo(
client, "causify-ai", "tutorials", top_n=30
)
_LOG.info("users: %s", users)INFO:github_utils:Fetched 30 contributors for causify-ai/tutorials
['sonaalKant', 'tkpratardan', 'gpsaggese', 'heanhsok', 'sonniki', 'aangelo9', 'Prahar08modi', 'Shaunak01', 'indrayudd', 'Swapnika29', 'Rohan-Ambati', 'protocorn', 'sathwikhnaik', 'ksurya14', 'SivaRajes', 'ojasonu', 'dhruv2009', 'rishikathakre', 'rkoush', 'Eyepatch0', 'gouravreddy02', 'beas28la', 'Jd8111997', 'bashaboinamanojkumar', 'Mayur074', 'x-claimer', 'mkdatadive', 'ReetikaaGajula2002', 'RithikaBaskaran', 'Ritik294']
Define Time Period
# Use a long window for caching and a narrow slice for final analysis.
period_full = github_utils.utc_period("2024-01-01", "2025-06-01")
period_slice = github_utils.utc_period("2025-04-01", "2025-05-31")
Specify Users and Repos to Fetch and Cache Data
# Choose your users and repositories.
users = [
    "Shaunak01",
    "tkpratardan",
    "Prahar08modi",
    "sandeepthalapanane",
    "indrayudd",
    "Swapnika29",
    "mongolianjesus",
    "cma0416",
]
repos = ["helpers", "tutorials", "cmamp"]
org = "causify-ai"
Pre-fetch all the data you need in cache
Query extraction takes time, so prefetch all data in cache for all the users, repos and time frames you need. once in cache there are several utility functions to help understand the user contribution. Following is the data we will fetch for users in multiple repos for the given period.
- Prs opened in the repo
- Commits done
- LOC [additions and deletions]
# This will call the GitHub API and write results to disk.
github_utils.prefetch_periodic_user_repo_data(
    client, org, repos, users, period_full
)
Prefetching user-repo data: 100%|███████████████████████████████████████████████████████████████████████████████████████████████████████████████████████████████████████████████████████████████████████| 24/24 [00:00<00:00, 406.38it/s]
INFO:github_utils:Prefetched 24 user-repo combos in 0.06 seconds for period 2024-01-01 00:00:00+00:00 to 2025-06-01 00:00:00+00:00.
helpers/Shaunak01: 23 commits, 30 PRs, 23 LOC entries, 39 issues assigned, 30 closed
helpers/tkpratardan: 6 commits, 7 PRs, 6 LOC entries, 5 issues assigned, 5 closed
helpers/Prahar08modi: 0 commits, 0 PRs, 0 LOC entries, 0 issues assigned, 0 closed
helpers/sandeepthalapanane: 20 commits, 26 PRs, 20 LOC entries, 24 issues assigned, 15 closed
helpers/indrayudd: 10 commits, 11 PRs, 10 LOC entries, 14 issues assigned, 10 closed
helpers/Swapnika29: 0 commits, 0 PRs, 0 LOC entries, 0 issues assigned, 0 closed
helpers/mongolianjesus: 1 commits, 1 PRs, 1 LOC entries, 0 issues assigned, 0 closed
helpers/cma0416: 0 commits, 0 PRs, 0 LOC entries, 0 issues assigned, 0 closed
tutorials/Shaunak01: 1 commits, 4 PRs, 1 LOC entries, 4 issues assigned, 2 closed
tutorials/tkpratardan: 16 commits, 21 PRs, 16 LOC entries, 16 issues assigned, 11 closed
tutorials/Prahar08modi: 6 commits, 7 PRs, 6 LOC entries, 11 issues assigned, 7 closed
tutorials/sandeepthalapanane: 0 commits, 0 PRs, 0 LOC entries, 0 issues assigned, 0 closed
tutorials/indrayudd: 2 commits, 4 PRs, 2 LOC entries, 4 issues assigned, 2 closed
tutorials/Swapnika29: 1 commits, 3 PRs, 1 LOC entries, 1 issues assigned, 0 closed
tutorials/mongolianjesus: 0 commits, 0 PRs, 0 LOC entries, 0 issues assigned, 0 closed
tutorials/cma0416: 0 commits, 0 PRs, 0 LOC entries, 0 issues assigned, 0 closed
cmamp/Shaunak01: 57 commits, 76 PRs, 57 LOC entries, 91 issues assigned, 80 closed
cmamp/tkpratardan: 45 commits, 54 PRs, 45 LOC entries, 66 issues assigned, 53 closed
cmamp/Prahar08modi: 0 commits, 0 PRs, 0 LOC entries, 0 issues assigned, 0 closed
cmamp/sandeepthalapanane: 0 commits, 0 PRs, 0 LOC entries, 0 issues assigned, 0 closed
cmamp/indrayudd: 0 commits, 0 PRs, 0 LOC entries, 0 issues assigned, 0 closed
cmamp/Swapnika29: 0 commits, 0 PRs, 0 LOC entries, 0 issues assigned, 0 closed
cmamp/mongolianjesus: 63 commits, 187 PRs, 63 LOC entries, 231 issues assigned, 210 closed
cmamp/cma0416: 4 commits, 14 PRs, 4 LOC entries, 19 issues assigned, 8 closed
Collect Daily Metrics
# This data has one row per (user, repo, date) with metrics: commits, PRs, issues, LOC changes.
combined_df = github_utils.collect_all_metrics(
    client, org, repos, users, period_full
)
_LOG.info("len(combined_df): %s", len(combined_df))
combined_df[904:].head()12432
Summarize Contributions and Visualize for Entire period that was cached
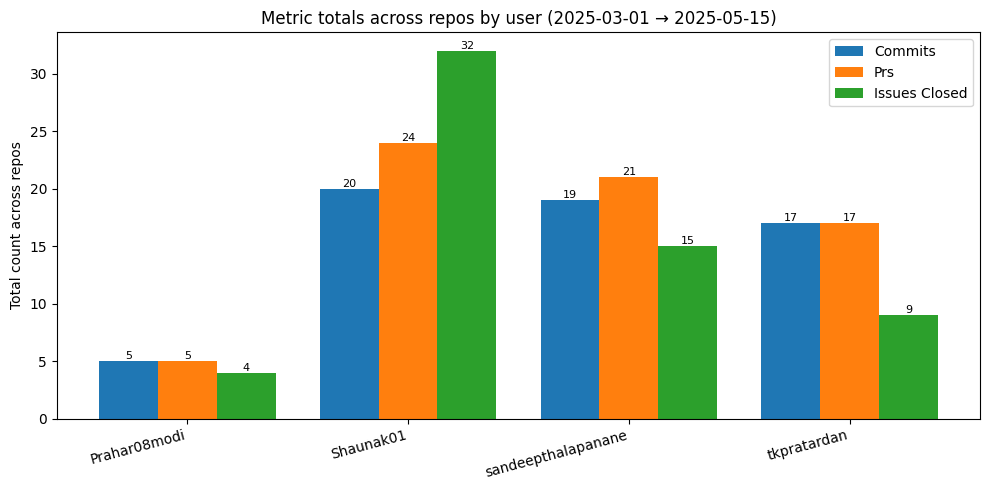
a. Compare users Total performance across selected repos
github_utils.plot_multi_metrics_totals_by_user(
    combined=combined_df,
    metrics=["commits", "prs", "issues_closed"],
    users=["Shaunak01", "tkpratardan", "Prahar08modi", "sandeepthalapanane"],
    repos=repos,
    start=datetime.datetime(2025, 3, 1),
    end=datetime.datetime(2025, 5, 15),
)
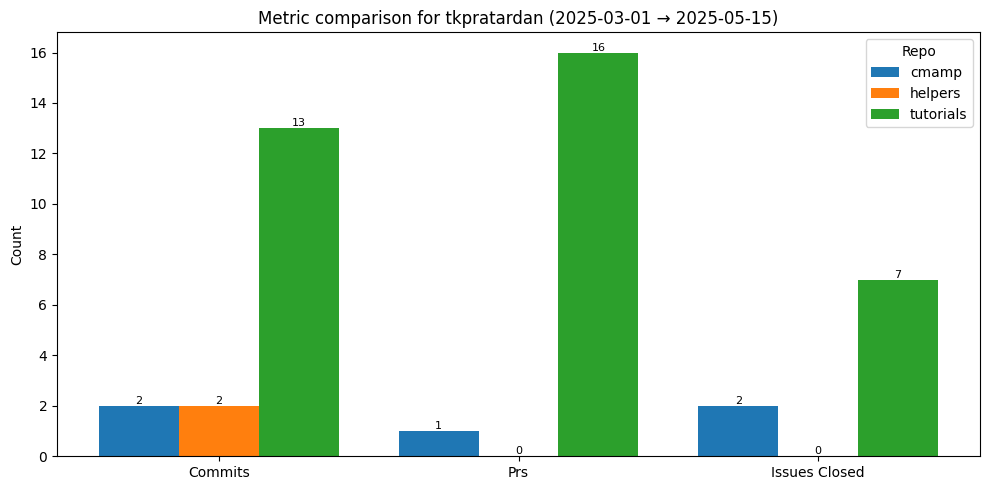
b. Compare a users performance Individually across repos
github_utils.plot_metrics_by_repo(
    combined=combined_df,
    user="tkpratardan",
    metrics=["commits", "prs", "issues_closed"],
    start=datetime.datetime(2025, 3, 1),
    end=datetime.datetime(2025, 5, 15),
)
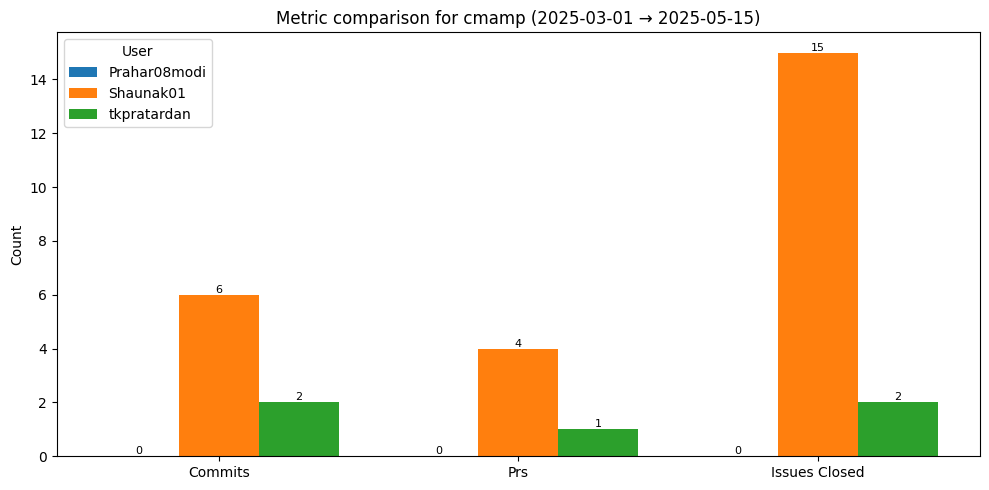
c. Compare Multiple users inside one repo
github_utils.plot_metrics_by_user(
    combined=combined_df,
    repo="cmamp",
    users=["tkpratardan", "Shaunak01", "Prahar08modi"],
    metrics=["commits", "prs", "issues_closed"],
    start=datetime.datetime(2025, 3, 1),
    end=datetime.datetime(2025, 5, 15),
)
Performance Evaluation
# Step 0: Define your slice.
users = ["Shaunak01", "tkpratardan", "Prahar08modi", "sandeepthalapanane"]
repos = ["cmamp", "helpers"]
metrics = ["commits", "prs", "issues_closed"]

# Step 1: Summarize total metrics across users/repos.
summary_users = github_utils.summarize_users_across_repos(
    combined_df, users=users, repos=repos
)

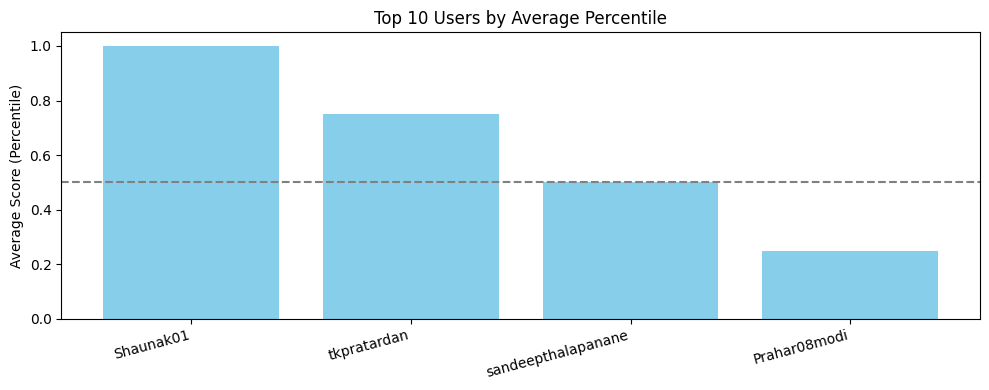
# Step 2: Add z-scores and percentiles.
z_df = github_utils.compute_z_scores(summary_users, metrics)
stats = github_utils.compute_percentile_ranks(z_df, metrics)

# Step 3: Visualize -- will automatically pick up all *_z or *_pctile columns.
github_utils.visualize_user_metric_comparison(stats, score_type="z")
github_utils.visualize_user_metric_comparison(stats, score_type="percentile")
📊 User performance (Z):
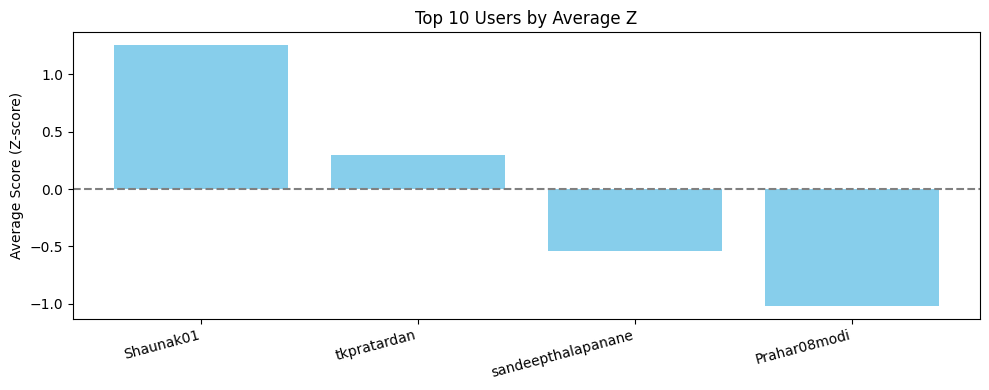
📊 User performance (Percentile):
There are many more helper funcs to see and compare statistics. Look at github_utils for more info -> docker_causify_style/github_utils.py