10 minutes to Dask
def print_obj(obj, tag=None):
    """
    Print an object in terms of type and then display is.
    """
    if tag:
        print(tag)
    print("type=", type(obj))
    display(obj)


def print_dask(obj):
    """
    Print information about a dask task graph.
    """
    print("type=", type(obj))
    print("obj=", obj)
    #
    print("# display")
    display(obj)
    #
    print("# dask")
    display(obj.dask)
    #
    print("# visualize")
    display(obj.visualize())
    #
    print("# compute")
    res = obj.compute()
    print(type(res))
print(res)DataFrame
Creating an object
import numpy as np
import pandas as pd

import dask.dataframe as dd
import dask.array as da
import dask.bag as db
# Create a df with 2400 rows indexed in datetimes.
index = pd.date_range("2021-09-01", periods=2400, freq="1H")
df = pd.DataFrame(
{"a": np.arange(2400), "b": list("abcaddbe" * 300)}, index=index
)
# Print the df as Pandas and Dask df.
print_obj(df, "# Pandas df")# Pandas df
type= <class 'pandas.core.frame.DataFrame'>
Loading...
# Convert object into Dask.
ddf = dd.from_pandas(df, npartitions=10)
print_dask(ddf)
type= <class 'dask.dataframe.core.DataFrame'>
obj= Dask DataFrame Structure:
a b
npartitions=10
2021-09-01 00:00:00 int64 object
2021-09-11 00:00:00 ... ...
... ... ...
2021-11-30 00:00:00 ... ...
2021-12-09 23:00:00 ... ...
Dask Name: from_pandas, 1 graph layer
# display
Loading...
# dask
Loading...
# visualize

# compute
<class 'pandas.core.frame.DataFrame'>
                        a  b
2021-09-01 00:00:00     0  a
2021-09-01 01:00:00     1  b
2021-09-01 02:00:00     2  c
2021-09-01 03:00:00     3  a
2021-09-01 04:00:00     4  d
...                   ... ..
2021-12-09 19:00:00  2395  a
2021-12-09 20:00:00  2396  d
2021-12-09 21:00:00  2397  d
2021-12-09 22:00:00  2398  b
2021-12-09 23:00:00  2399  e

[2400 rows x 2 columns]
# Print the partitions, in terms of indices covered by each partition.
obj = ddf.divisions
print_obj(obj)
type= <class 'tuple'>
(Timestamp('2021-09-01 00:00:00', freq='H'),
 Timestamp('2021-09-11 00:00:00', freq='H'),
 Timestamp('2021-09-21 00:00:00', freq='H'),
 Timestamp('2021-10-01 00:00:00', freq='H'),
 Timestamp('2021-10-11 00:00:00', freq='H'),
 Timestamp('2021-10-21 00:00:00', freq='H'),
 Timestamp('2021-10-31 00:00:00', freq='H'),
 Timestamp('2021-11-10 00:00:00', freq='H'),
 Timestamp('2021-11-20 00:00:00', freq='H'),
 Timestamp('2021-11-30 00:00:00', freq='H'),
 Timestamp('2021-12-09 23:00:00', freq='H'))
# Print one partition.
obj = ddf.partitions[1]
print_obj(obj)type= <class 'dask.dataframe.core.DataFrame'>
Loading...
Indexing
obj = ddf["b"]
print_dask(obj)
type= <class 'dask.dataframe.core.Series'>
obj= Dask Series Structure:
npartitions=10
2021-09-01 00:00:00 object
2021-09-11 00:00:00 ...
...
2021-11-30 00:00:00 ...
2021-12-09 23:00:00 ...
Name: b, dtype: object
Dask Name: getitem, 2 graph layers
# display
Dask Series Structure:
npartitions=10
2021-09-01 00:00:00    object
2021-09-11 00:00:00       ...
                        ...
2021-11-30 00:00:00       ...
2021-12-09 23:00:00       ...
Name: b, dtype: object
Dask Name: getitem, 2 graph layers
# dask
Loading...
# visualize
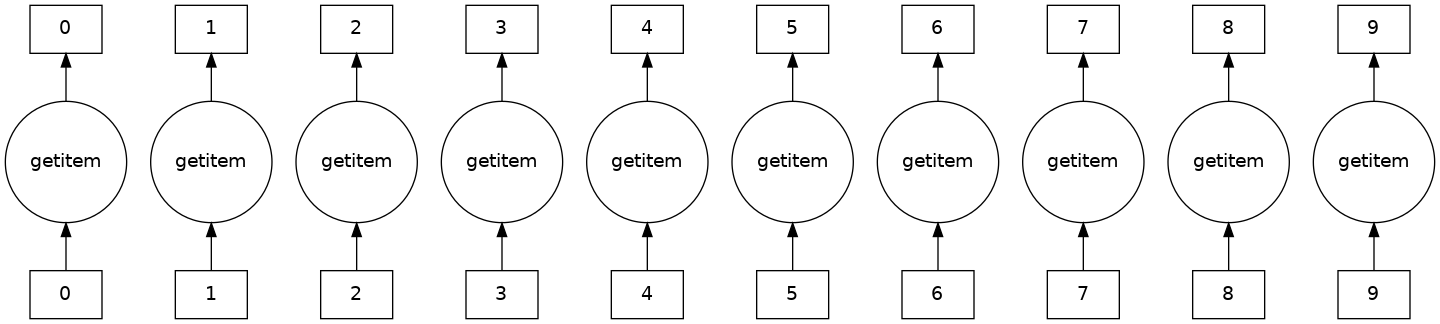
# compute
<class 'pandas.core.series.Series'>
2021-09-01 00:00:00    a
2021-09-01 01:00:00    b
2021-09-01 02:00:00    c
2021-09-01 03:00:00    a
2021-09-01 04:00:00    d
                      ..
2021-12-09 19:00:00    a
2021-12-09 20:00:00    d
2021-12-09 21:00:00    d
2021-12-09 22:00:00    b
2021-12-09 23:00:00    e
Freq: H, Name: b, Length: 2400, dtype: object
# This doesn't force to execute.
obj = ddf["2021-10-01":"2021-10-09 5:00"]
print_obj(obj)
type= <class 'dask.dataframe.core.DataFrame'>
Loading...
print_dask(obj)type= <class 'dask.dataframe.core.DataFrame'>
obj= Dask DataFrame Structure:
a b
npartitions=1
2021-10-01 00:00:00.000000000 int64 object
2021-10-09 05:00:59.999999999 ... ...
Dask Name: loc, 2 graph layers
# display
Loading...
# dask
Loading...
# visualize
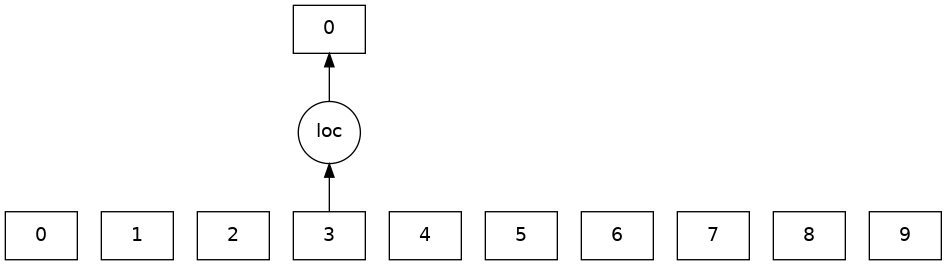
# compute
<class 'pandas.core.frame.DataFrame'>
                       a  b
2021-10-01 00:00:00  720  a
2021-10-01 01:00:00  721  b
2021-10-01 02:00:00  722  c
2021-10-01 03:00:00  723  a
2021-10-01 04:00:00  724  d
...                  ... ..
2021-10-09 01:00:00  913  b
2021-10-09 02:00:00  914  c
2021-10-09 03:00:00  915  a
2021-10-09 04:00:00  916  d
2021-10-09 05:00:00  917  d

[198 rows x 2 columns]
Computation
# Force to read, in fact the output is a Pandas DataFrame.
obj = ddf["2021-10-01":"2021-10-09 5:00"].compute()
print_obj(obj)
type= <class 'pandas.core.frame.DataFrame'>
Loading...
Methods
# Compute the mean of a column (delayed).
obj = ddf.a.mean()
print_obj(obj)
type= <class 'dask.dataframe.core.Scalar'>
dd.Scalar<series-..., dtype=float64>print_dask(obj)type= <class 'dask.dataframe.core.Scalar'>
obj= dd.Scalar<series-..., dtype=float64>
# display
dd.Scalar<series-..., dtype=float64># dask
Loading...
# visualize
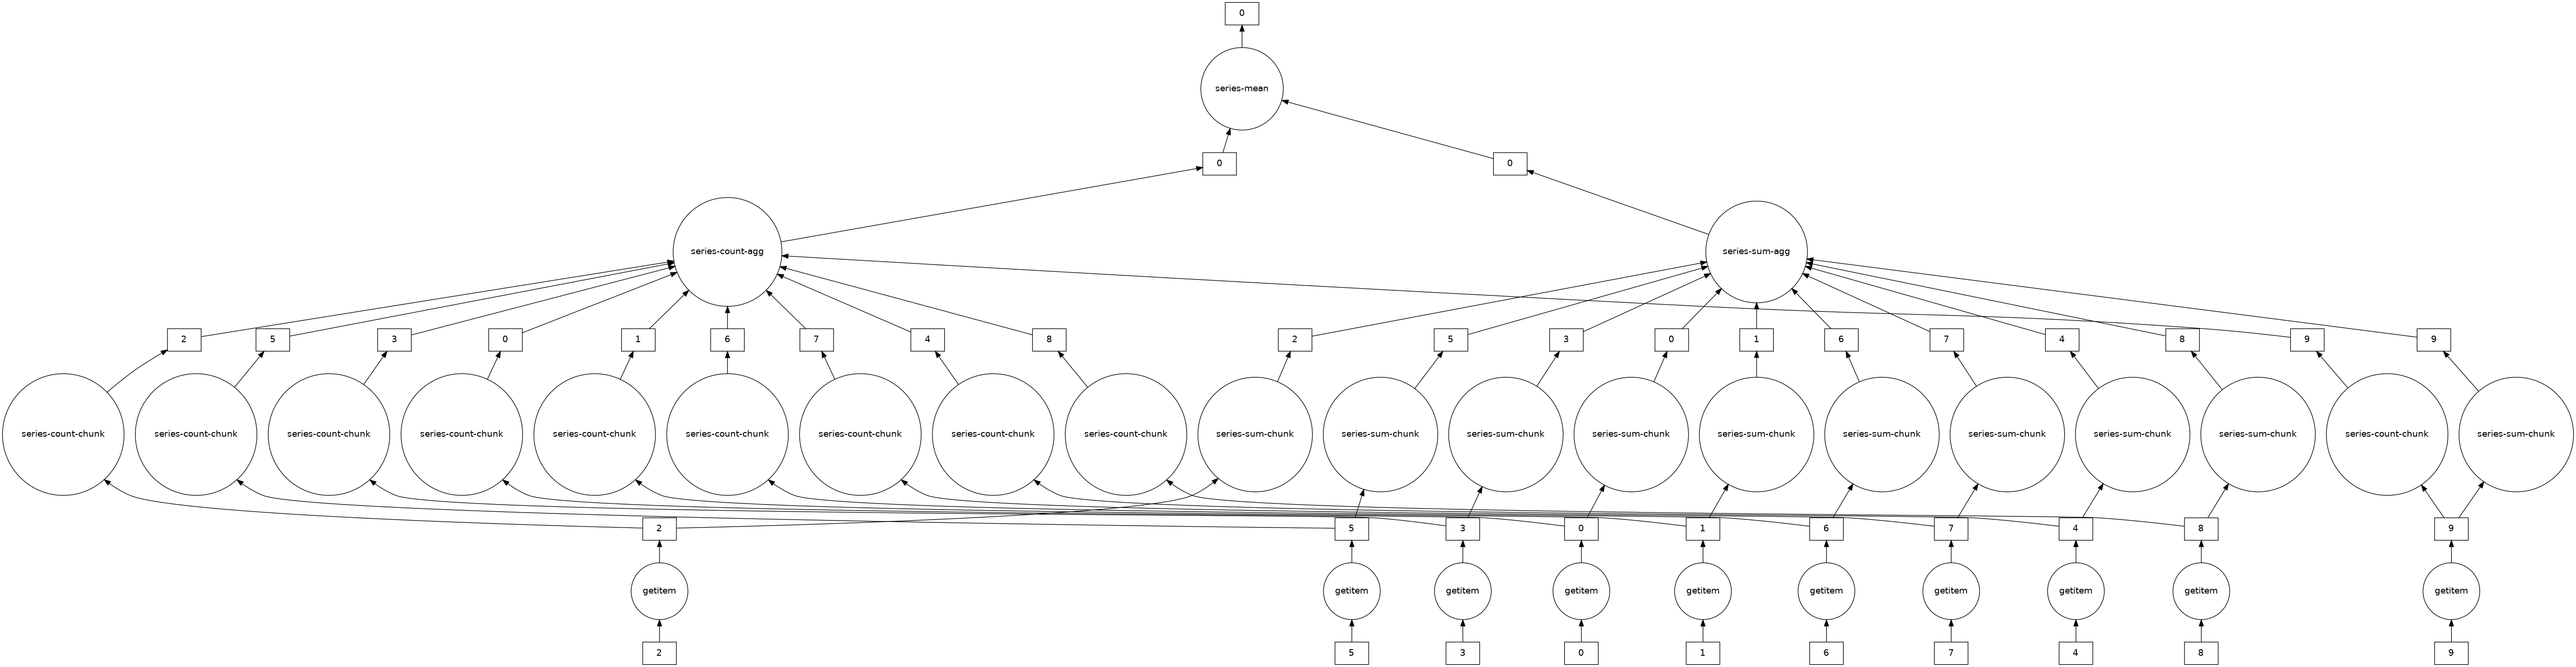
# compute
<class 'numpy.float64'>
1199.5
# Note that the types are different.
obj = ddf["b"].unique().compute()
print_obj(obj)

obj = ddf["b"].compute().unique()
print_obj(obj)
type= <class 'pandas.core.series.Series'>
0    a
1    b
2    c
3    d
4    e
Name: b, dtype: object
type= <class 'numpy.ndarray'>
array(['a', 'b', 'c', 'd', 'e'], dtype=object)# Methods can be chained together like in Pandas.
result = ddf["2021-10-01":"2021-10-09 5:00"].a.cumsum() - 100
print_obj(result)type= <class 'dask.dataframe.core.Series'>
Dask Series Structure:
npartitions=1
2021-10-01 00:00:00.000000000    int64
2021-10-09 05:00:59.999999999      ...
Name: a, dtype: int64
Dask Name: sub, 7 graph layers
# Materialize.
obj = result.compute()
print_obj(obj)type= <class 'pandas.core.series.Series'>
2021-10-01 00:00:00       620
2021-10-01 01:00:00      1341
2021-10-01 02:00:00      2063
2021-10-01 03:00:00      2786
2021-10-01 04:00:00      3510
                        ...
2021-10-09 01:00:00    158301
2021-10-09 02:00:00    159215
2021-10-09 03:00:00    160130
2021-10-09 04:00:00    161046
2021-10-09 05:00:00    161963
Freq: H, Name: a, Length: 198, dtype: int64
Visualize the Task Graph
# result = ddf["2021-10-01": "2021-10-09 5:00"].a.cumsum() - 100
# result is a graph.
print_dask(result)
type= <class 'dask.dataframe.core.Series'>
obj= Dask Series Structure:
npartitions=1
2021-10-01 00:00:00.000000000 int64
2021-10-09 05:00:59.999999999 ...
Name: a, dtype: int64
Dask Name: sub, 7 graph layers
# display
Dask Series Structure:
npartitions=1
2021-10-01 00:00:00.000000000    int64
2021-10-09 05:00:59.999999999      ...
Name: a, dtype: int64
Dask Name: sub, 7 graph layers
# dask
Loading...
# visualize
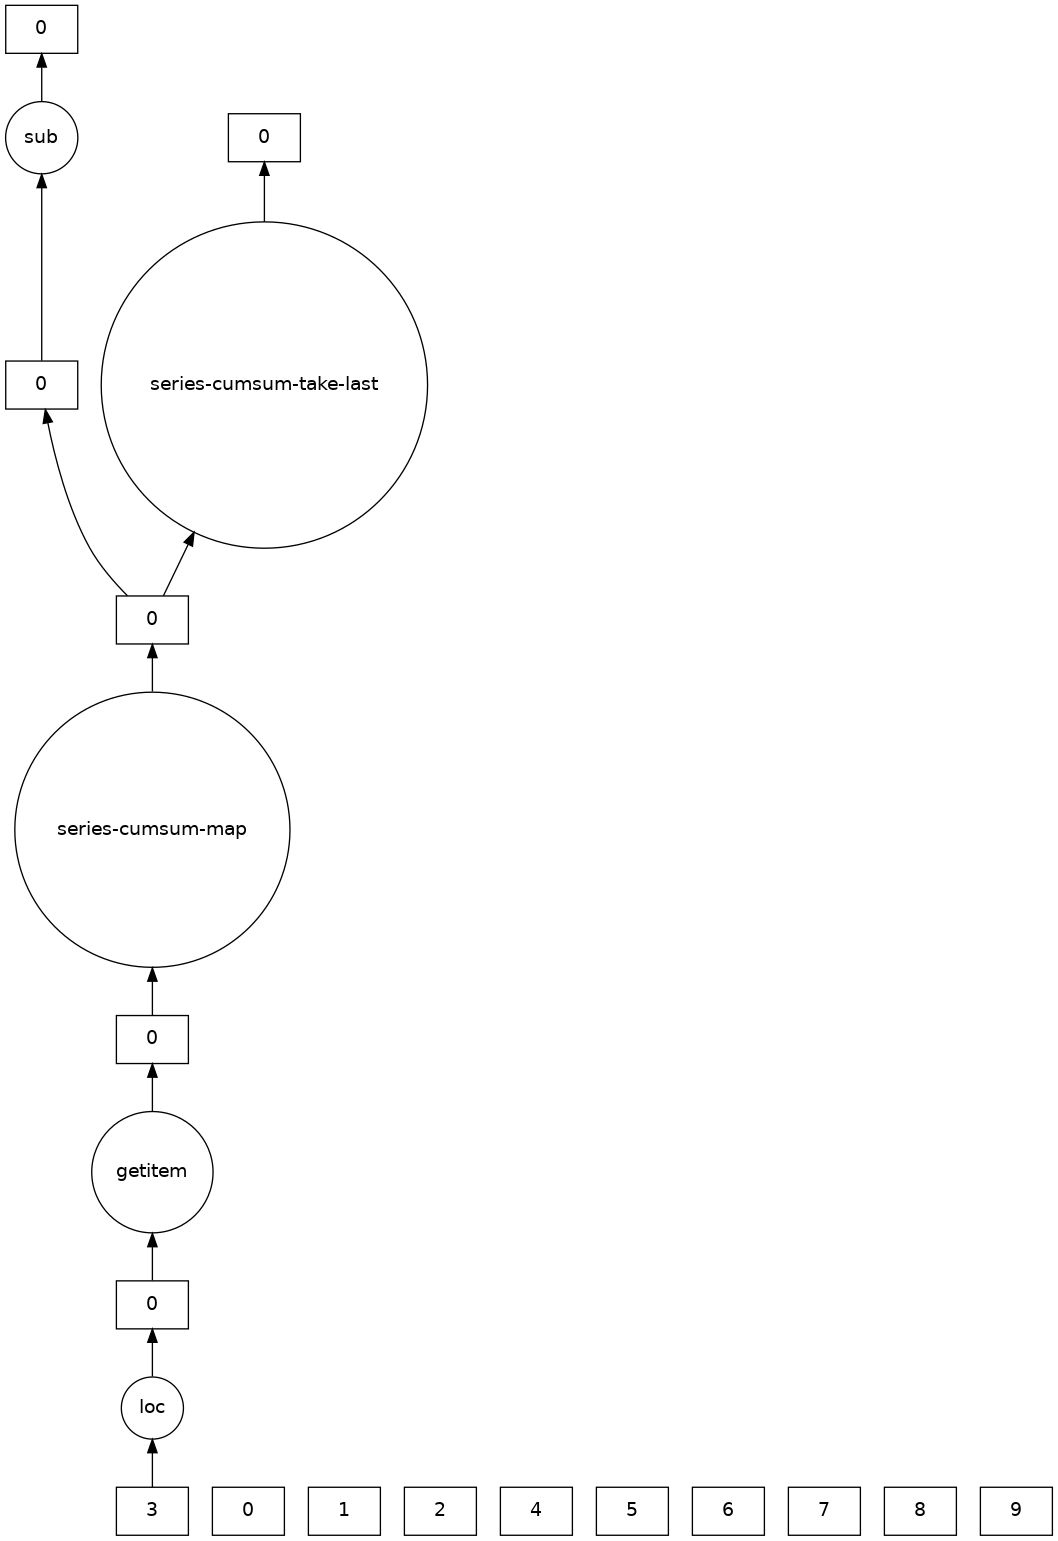
# compute
<class 'pandas.core.series.Series'>
2021-10-01 00:00:00       620
2021-10-01 01:00:00      1341
2021-10-01 02:00:00      2063
2021-10-01 03:00:00      2786
2021-10-01 04:00:00      3510
                        ...
2021-10-09 01:00:00    158301
2021-10-09 02:00:00    159215
2021-10-09 03:00:00    160130
2021-10-09 04:00:00    161046
2021-10-09 05:00:00    161963
Freq: H, Name: a, Length: 198, dtype: int64
Array
import numpy as np

# Create a 200 x 500 array.
data = np.arange(100_000).reshape(200, 500)
print(type(data), data.shape)
print("data=\n%s" % data)
<class 'numpy.ndarray'> (200, 500)
data=
[[ 0 1 2 ... 497 498 499]
[ 500 501 502 ... 997 998 999]
[ 1000 1001 1002 ... 1497 1498 1499]
...
[98500 98501 98502 ... 98997 98998 98999]
[99000 99001 99002 ... 99497 99498 99499]
[99500 99501 99502 ... 99997 99998 99999]]
# Split in 100x100 chunks.
a = da.from_array(data, chunks=(100, 100))
print_dask(a)

# There are 10 chunks.
type= <class 'dask.array.core.Array'>
obj= dask.array<array, shape=(200, 500), dtype=int64, chunksize=(100, 100), chunktype=numpy.ndarray>
# display
Loading...
# dask
Loading...
# visualize

# compute
<class 'numpy.ndarray'>
[[    0     1     2 ...   497   498   499]
 [  500   501   502 ...   997   998   999]
 [ 1000  1001  1002 ...  1497  1498  1499]
 ...
 [98500 98501 98502 ... 98997 98998 98999]
 [99000 99001 99002 ... 99497 99498 99499]
 [99500 99501 99502 ... 99997 99998 99999]]
a.chunksize(100, 100)a.chunks((100, 100), (100, 100, 100, 100, 100))# Extract a block.
a.blocks[1, 3]Loading...
Indexing
# Slice.
# No computation is performed.
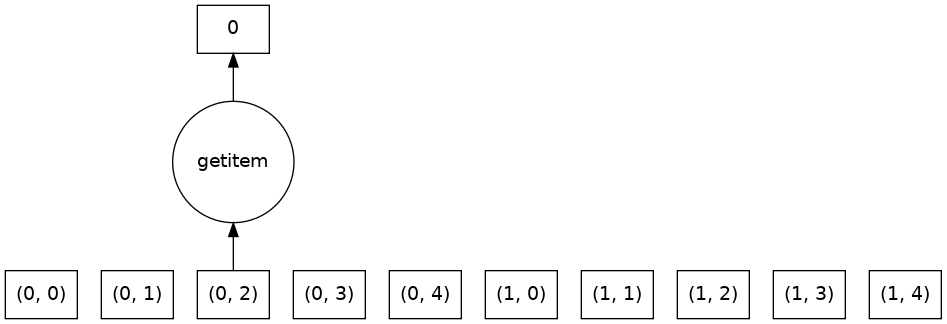
y = a[:50, 200]print_dask(y)type= <class 'dask.array.core.Array'>
obj= dask.array<getitem, shape=(50,), dtype=int64, chunksize=(50,), chunktype=numpy.ndarray>
# display
Loading...
# dask
Loading...
# visualize
# compute
<class 'numpy.ndarray'>
[  200   700  1200  1700  2200  2700  3200  3700  4200  4700  5200  5700
  6200  6700  7200  7700  8200  8700  9200  9700 10200 10700 11200 11700
 12200 12700 13200 13700 14200 14700 15200 15700 16200 16700 17200 17700
 18200 18700 19200 19700 20200 20700 21200 21700 22200 22700 23200 23700
 24200 24700]
# Computation.
a[:50, 200].compute()
array([ 200, 700, 1200, 1700, 2200, 2700, 3200, 3700, 4200,
4700, 5200, 5700, 6200, 6700, 7200, 7700, 8200, 8700,
9200, 9700, 10200, 10700, 11200, 11700, 12200, 12700, 13200,
13700, 14200, 14700, 15200, 15700, 16200, 16700, 17200, 17700,
18200, 18700, 19200, 19700, 20200, 20700, 21200, 21700, 22200,
22700, 23200, 23700, 24200, 24700])Methods
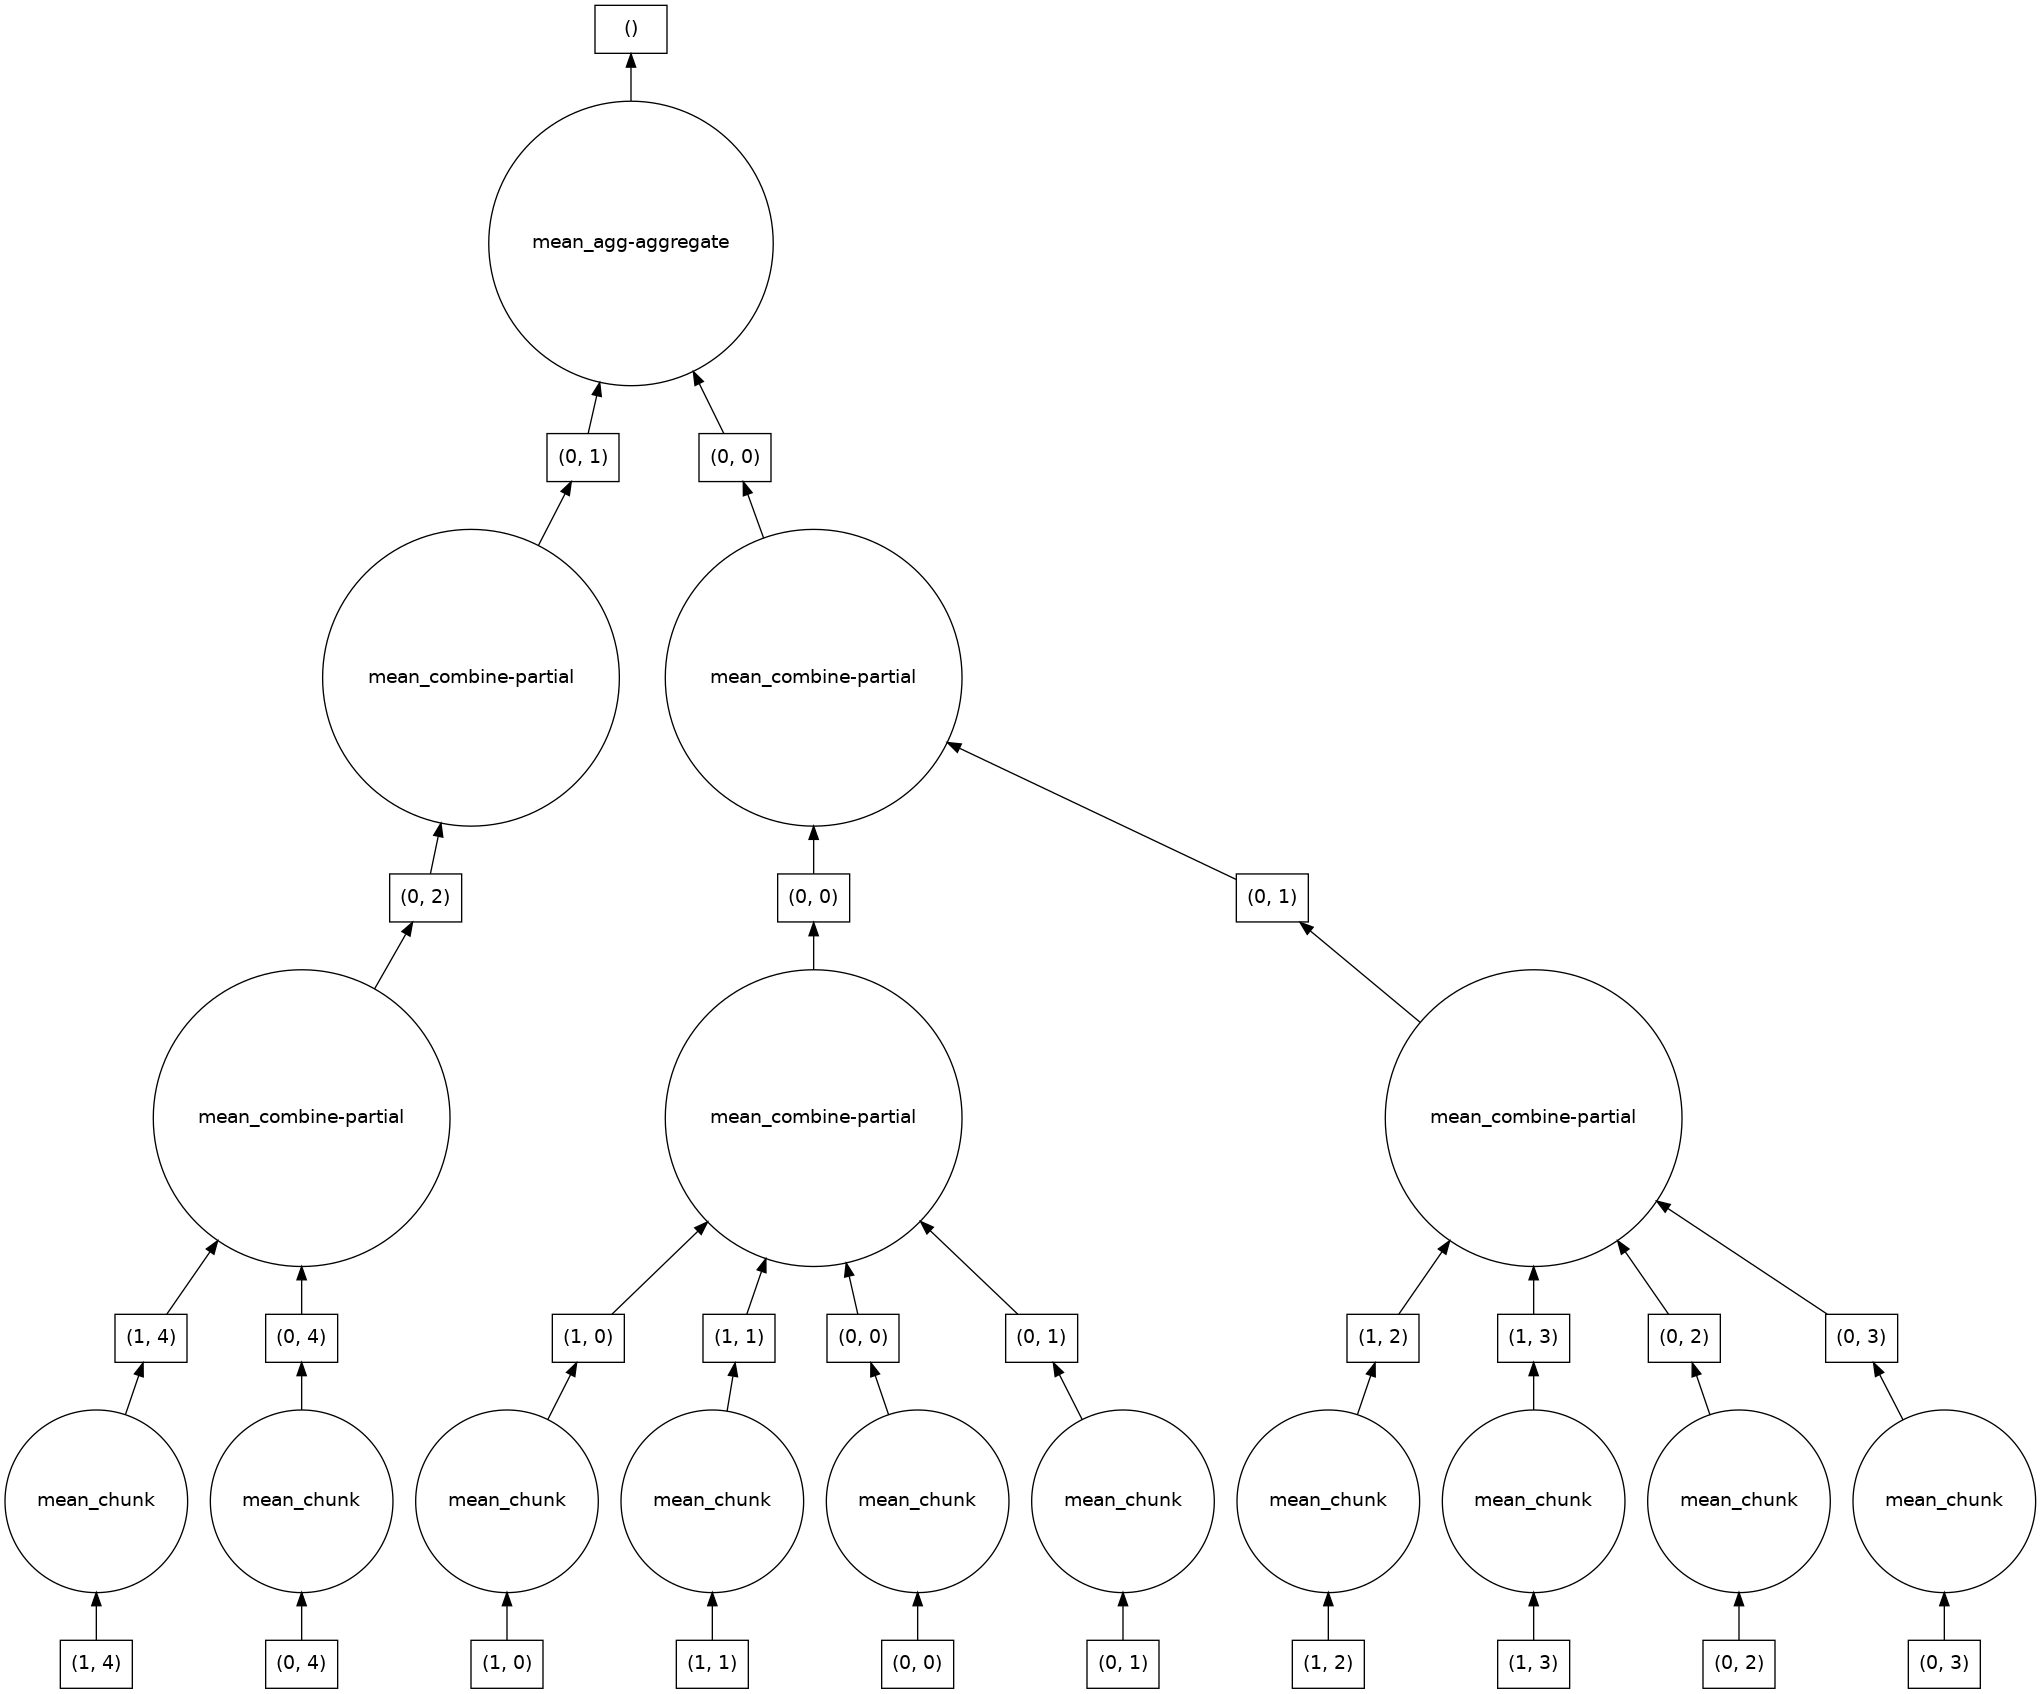
y = a.mean()
print_dask(y)

# Returns a scalar.
type= <class 'dask.array.core.Array'>
obj= dask.array<mean_agg-aggregate, shape=(), dtype=float64, chunksize=(), chunktype=numpy.ndarray>
# display
Loading...
# dask
Loading...
# visualize
# compute
<class 'numpy.float64'>
49999.5
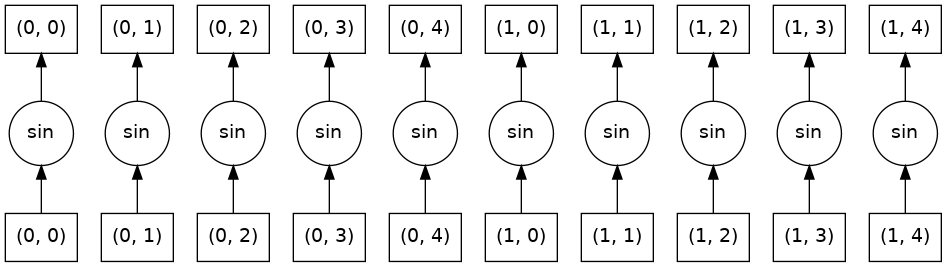
y = np.sin(a)
print_dask(y)
type= <class 'dask.array.core.Array'>
obj= dask.array<sin, shape=(200, 500), dtype=float64, chunksize=(100, 100), chunktype=numpy.ndarray>
# display
Loading...
# dask
Loading...
# visualize
# compute
<class 'numpy.ndarray'>
[[ 0.          0.84147098  0.90929743 ...  0.58781939  0.99834363
   0.49099533]
 [-0.46777181 -0.9964717  -0.60902011 ... -0.89796748 -0.85547315
  -0.02646075]
 [ 0.82687954  0.9199906   0.16726654 ...  0.99951642  0.51387502
  -0.4442207 ]
 ...
 [-0.99720859 -0.47596473  0.48287891 ... -0.76284376  0.13191447
   0.90539115]
 [ 0.84645538  0.00929244 -0.83641393 ...  0.37178568 -0.5802765
  -0.99883514]
 [-0.49906936  0.45953849  0.99564877 ...  0.10563876  0.89383946
   0.86024828]]
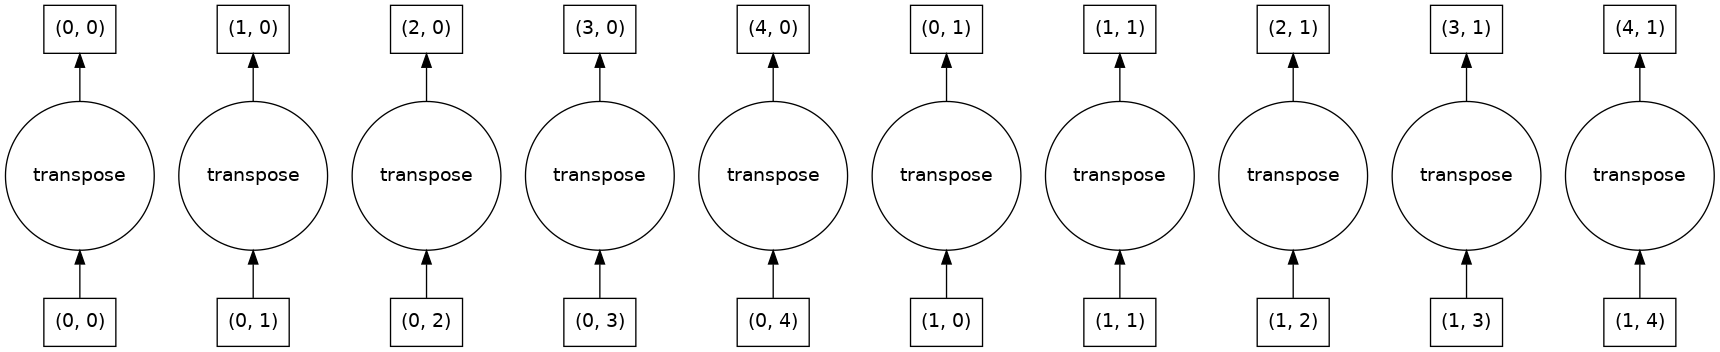
y = a.T
print_dask(y)
type= <class 'dask.array.core.Array'>
obj= dask.array<transpose, shape=(500, 200), dtype=int64, chunksize=(100, 100), chunktype=numpy.ndarray>
# display
Loading...
# dask
Loading...
# visualize
# compute
<class 'numpy.ndarray'>
[[    0   500  1000 ... 98500 99000 99500]
 [    1   501  1001 ... 98501 99001 99501]
 [    2   502  1002 ... 98502 99002 99502]
 ...
 [  497   997  1497 ... 98997 99497 99997]
 [  498   998  1498 ... 98998 99498 99998]
 [  499   999  1499 ... 98999 99499 99999]]
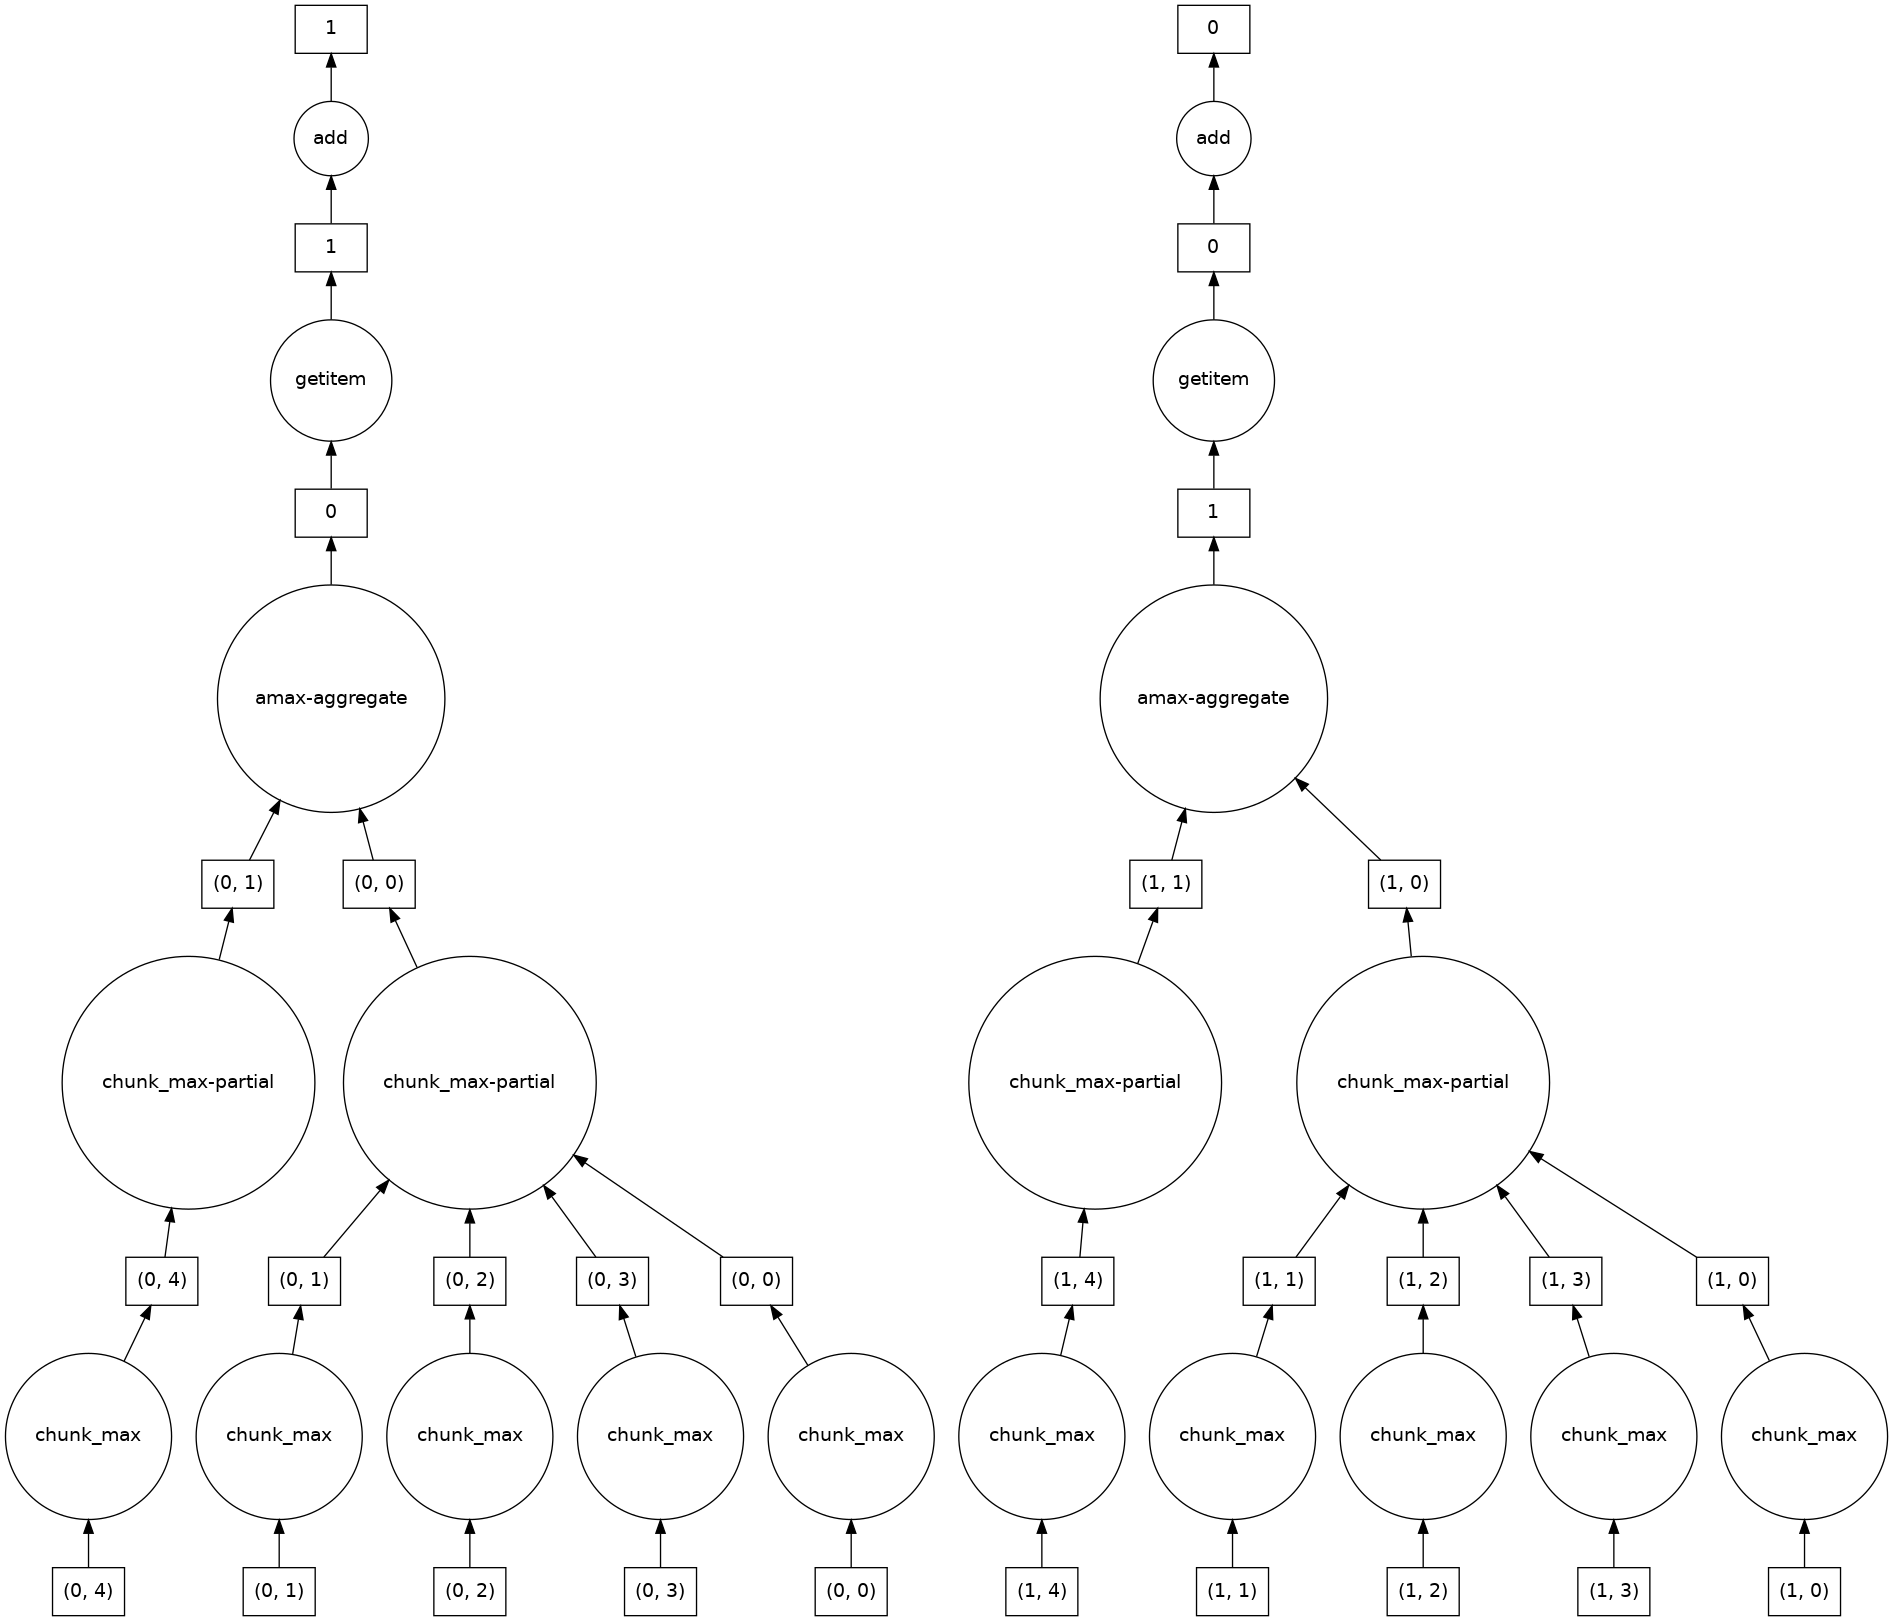
b = a.max(axis=1)[::-1] + 10
print_dask(b)
type= <class 'dask.array.core.Array'>
obj= dask.array<add, shape=(200,), dtype=int64, chunksize=(100,), chunktype=numpy.ndarray>
# display
Loading...
# dask
Loading...
# visualize
# compute
<class 'numpy.ndarray'>
[100009  99509  99009  98509  98009  97509  97009  96509  96009  95509
  95009  94509  94009  93509  93009  92509  92009  91509  91009  90509
  90009  89509  89009  88509  88009  87509  87009  86509  86009  85509
  85009  84509  84009  83509  83009  82509  82009  81509  81009  80509
  80009  79509  79009  78509  78009  77509  77009  76509  76009  75509
  75009  74509  74009  73509  73009  72509  72009  71509  71009  70509
  70009  69509  69009  68509  68009  67509  67009  66509  66009  65509
  65009  64509  64009  63509  63009  62509  62009  61509  61009  60509
  60009  59509  59009  58509  58009  57509  57009  56509  56009  55509
  55009  54509  54009  53509  53009  52509  52009  51509  51009  50509
  50009  49509  49009  48509  48009  47509  47009  46509  46009  45509
  45009  44509  44009  43509  43009  42509  42009  41509  41009  40509
  40009  39509  39009  38509  38009  37509  37009  36509  36009  35509
  35009  34509  34009  33509  33009  32509  32009  31509  31009  30509
  30009  29509  29009  28509  28009  27509  27009  26509  26009  25509
  25009  24509  24009  23509  23009  22509  22009  21509  21009  20509
  20009  19509  19009  18509  18009  17509  17009  16509  16009  15509
  15009  14509  14009  13509  13009  12509  12009  11509  11009  10509
  10009   9509   9009   8509   8009   7509   7009   6509   6009   5509
   5009   4509   4009   3509   3009   2509   2009   1509   1009    509]
Visualize the Task Graph
b.daskLoading...
b.visualize()Bag
Creating a Dask object
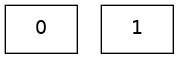
# 8 items in two partitions.
b = db.from_sequence([1, 2, 3, 4, 5, 6, 2, 1], npartitions=2)

print_dask(b)
type= <class 'dask.bag.core.Bag'>
obj= dask.bag<from_sequence, npartitions=2>
# display
dask.bag<from_sequence, npartitions=2># dask
Loading...
# visualize
# compute
<class 'list'>
[1, 2, 3, 4, 5, 6, 2, 1]
Indexing
Computation
b.compute()[1, 2, 3, 4, 5, 6, 2, 1]Methods
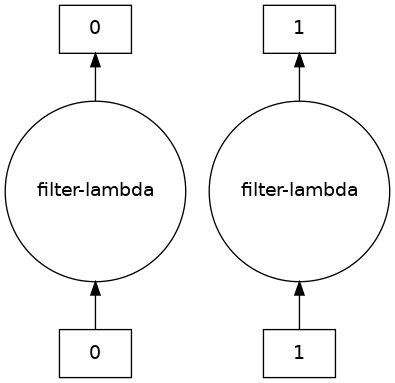
obj = b.filter(lambda x: x % 2)

print_dask(obj)
type= <class 'dask.bag.core.Bag'>
obj= dask.bag<filter-lambda, npartitions=2>
# display
dask.bag<filter-lambda, npartitions=2># dask
Loading...
# visualize
# compute
<class 'list'>
[1, 3, 5, 1]
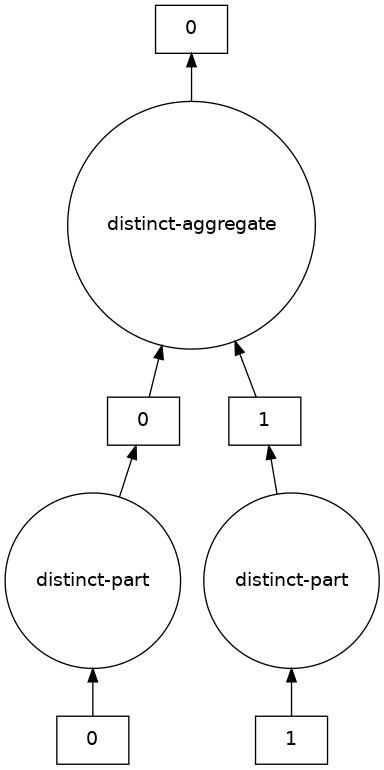
obj.compute()[1, 3, 5, 1]obj = b.distinct()
print_dask(obj)type= <class 'dask.bag.core.Bag'>
obj= dask.bag<distinct-aggregate, npartitions=1>
# display
dask.bag<distinct-aggregate, npartitions=1># dask
Loading...
# visualize
# compute
<class 'list'>
[1, 2, 3, 4, 5, 6]
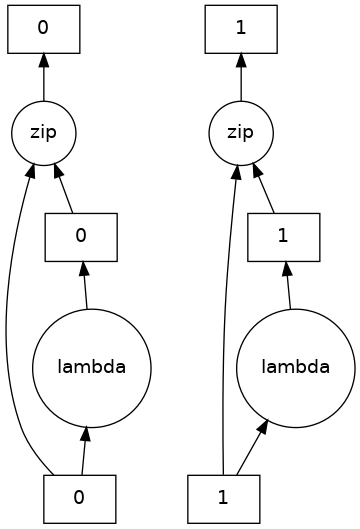
obj.compute()[1, 2, 3, 4, 5, 6]obj = db.zip(b, b.map(lambda x: x * 10))
print_dask(obj)type= <class 'dask.bag.core.Bag'>
obj= dask.bag<zip, npartitions=2>
# display
dask.bag<zip, npartitions=2># dask
Loading...
# visualize
# compute
<class 'list'>
[(1, 10), (2, 20), (3, 30), (4, 40), (5, 50), (6, 60), (2, 20), (1, 10)]
Low-level interfaces
Delayed
# In the following example there is parallelism to exploit, but it doesn't fit one of
# the native Dask data structures.


def inc(x):
    return x + 1


def double(x):
    return x * 2


def add(x, y):
    return x + y


data = [1, 2, 3, 4, 5]

output = []
for x in data:
    # (x + 1) + (x * 2) = 3x + 1
    a = inc(x)
    b = double(x)
    c = add(a, b)
    # 1 -> 4
    # 2 -> 7
    # 3 -> 10
    # 4 -> 13
    # 5 -> 16
    output.append(c)

# 4 + 7 + 10 + 13 + 16 = 20 + 20 + 10 = 50
total = sum(output)
print(total)
50
# Decorate

import dask

# This is equivalent to the decorator.
# @dask.delayed
# def inc(x):
#     return x + 1


output = []
for x in data:
    a = dask.delayed(inc)(x)
    b = dask.delayed(double)(x)
    c = dask.delayed(add)(a, b)
    output.append(c)

total = dask.delayed(sum)(output)

total.dask
Loading...
# This is the computation inside a node.
c.visualize()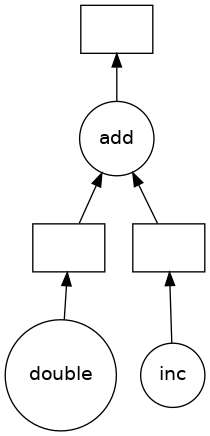
# This is the unrolled computation.
total.visualize()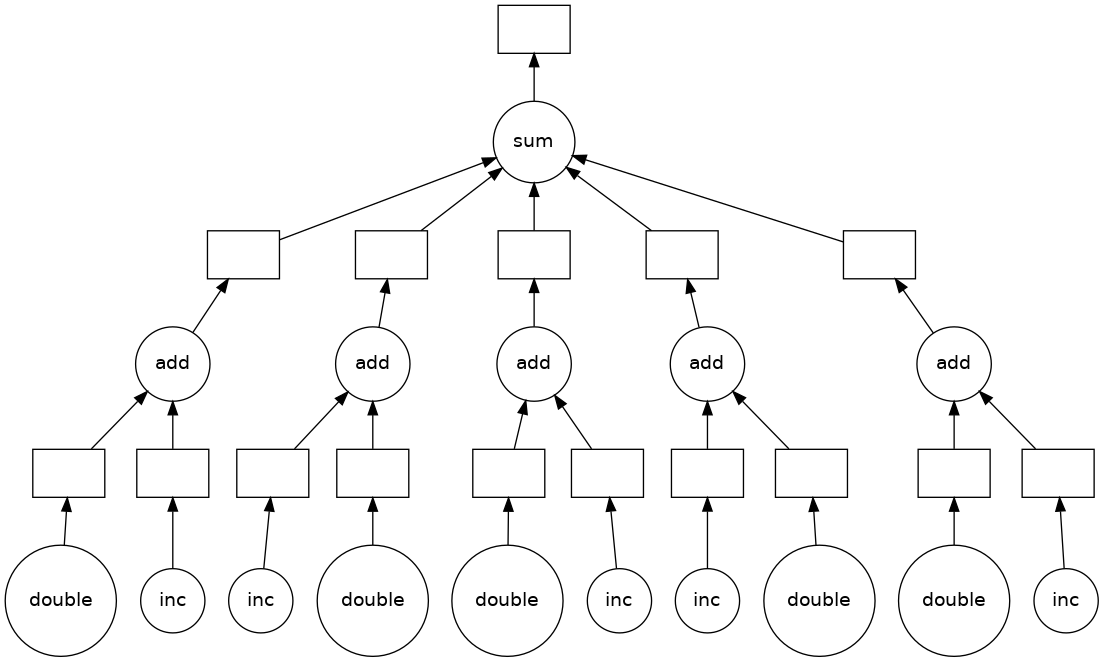
# Trigger the computation.
total.compute()50Futures
# https://stackoverflow.com/questions/59070260/dask-client-detect-local-default-cluster-already-running
import os

os.environ["DASK_SCHEDULER_ADDRESS"] = "tcp://localhost:8786"

if not ("cluster" in globals() and "client" in globals()):
    from dask.distributed import Client, LocalCluster

    cluster = LocalCluster(dashboard_address=":8787")
    client = Client(cluster)
    print(client, client.dashboard_link)
/usr/local/lib/python3.10/dist-packages/distributed/node.py:182: UserWarning: Port 8787 is already in use.
Perhaps you already have a cluster running?
Hosting the HTTP server on port 42039 instead
warnings.warn(
<Client: 'tcp://127.0.0.1:38445' processes=4 threads=8, memory=31.01 GiB> http://127.0.0.1:42039/status
# import time
# from dask.distributed import Client, LocalCluster
# with LocalCluster(dashboard_address=':8787') as cluster:
#    with Client(cluster) as client:
#        print(client, client.dashboard_link)
# time.sleep(1)
# with LocalCluster(dashboard_address=':8787') as cluster:
#    with Client(cluster) as client:
#        print(client, client.dashboard_link)
from dask.distributed import Client, LocalCluster
def inc(x):
return x + 1
def add(x, y):
return x + y
# Submit and start eagerly.
a = client.submit(inc, 1)
b = client.submit(inc, 2)
c = client.submit(add, a, b)
# This is blocking until everything is completed.
c = c.result()Scheduling
# from dask.distributed import Client

# client = Client()
# clientclient.dashboard_link'http://127.0.0.1:42039/status'