Imports
try:
    import arviz as az
except ModuleNotFoundError:
    !sudo /bin/bash -c "(source /venv/bin/activate; pip install --quiet arviz)"
    pass

try:
    import graphviz
except ModuleNotFoundError:
    !sudo /bin/bash -c "(source /venv/bin/activate; pip install --quiet graphviz)"
    pass
Print config
!python --version

!uname -a

#
import numpy as np

print("numpy version=", np.__version__)

#
import pymc as pm

print("pymc3 version=", pm.__version__)

import matplotlib

print("matplotlib version=", matplotlib.__version__)

#
import arviz as az

print("arviz version=", az.__version__)

#
import graphviz

print("graphviz version=", graphviz.__version__)
Python 3.12.3
Linux 78f731e61420 6.6.22-linuxkit #1 SMP Fri Mar 29 12:21:27 UTC 2024 aarch64 aarch64 aarch64 GNU/Linux
numpy version= 1.26.4
pymc3 version= 5.16.2
matplotlib version= 3.9.2
arviz version= 0.19.0
graphviz version= 0.20.3
plt.rcParams["figure.figsize"] = [8, 3]From https://
- ArviZ is a package for exploratory analysis of Bayesian models.
- It is backend agnostic (e.g., PyStan, PyMC, raw
numpyarrays)
Getting Started
From https://
Get started with plotting
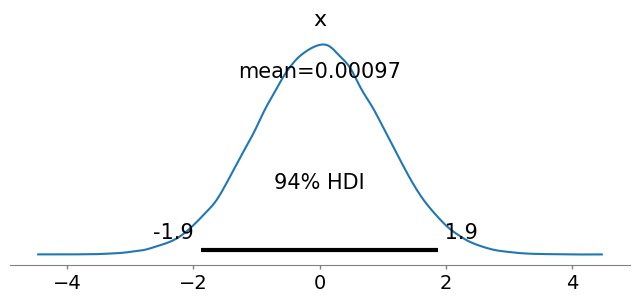
# - Plot a distribution with some info about HDI (highest density interval).

# Sample a Gaussian.
np.random.seed(42)
vals = np.random.randn(100_000)
print("vals.shape=", vals.shape)
print("vals=", vals)

# Plot PDF.
az.plot_posterior(vals)
vals.shape= (100000,)
vals= [ 0.49671415 -0.1382643 0.64768854 ... 0.40918508 -0.21109167
0.12006294]
# `arviz` interprets a 2d array as "chain x draws".
# Build 10 chains and 50 draws each.
size = (10, 50)
vals = np.random.randn(*size)

# When plotting all the samples are flattened.
az.plot_posterior(vals)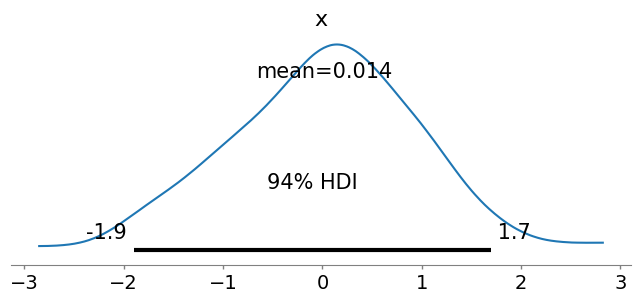
# /venv/lib/python3.9/site-packages/arviz/plots/backends/matplotlib/forestplot.py:545: UserWarning: The `squeeze` kwarg to GroupBy is being
# removed.Pass .groupby(..., squeeze=False) to disable squeezing, which is the new default, and to silence this warning.
# for _, sub_data in grouped_datum:
# warnings.filterwarnings("error", category=FutureWarning, message="Series.__getitem__")
size = (5, 50)
# A dict is interpreted as multiple random vars, each with different "chains x draws".
data = {
"normal": np.random.randn(*size),
"gumbel": np.random.gumbel(size=size),
# "student t": np.random.standard_t(df=6, size=size),
# "exponential": np.random.exponential(size=size),
}
az.plot_forest(data)
# There are several RVs, each with 5 realizations, each realization with 50 samples.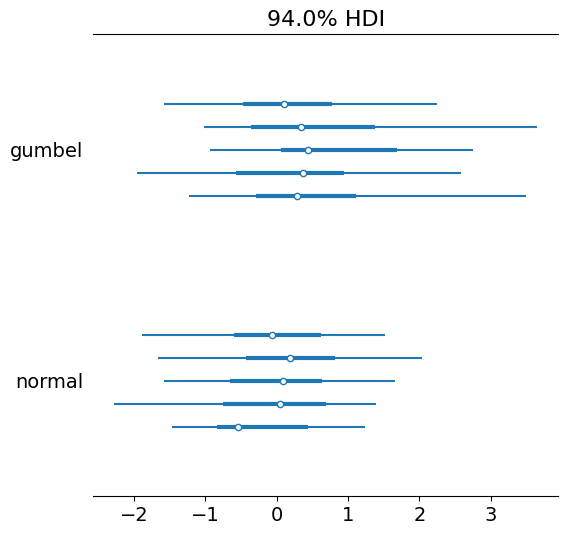
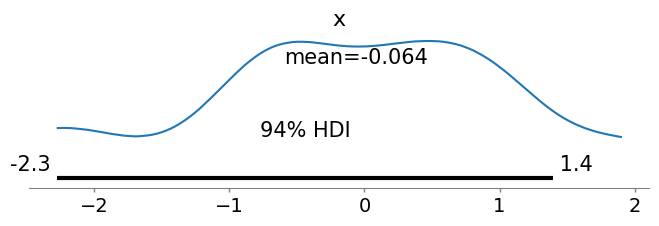
az.plot_posterior(data["normal"][0])
az.plot_posterior(data["normal"][1])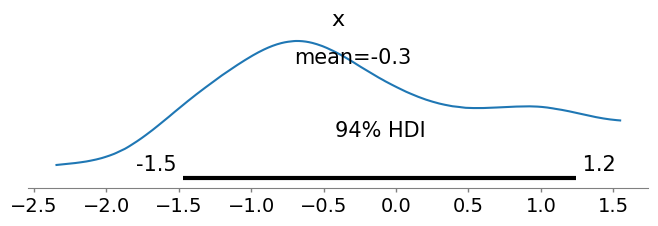
# data["normal"] is a 10 chains x 50 samples, but when plotting all the data is concat.
az.plot_posterior(data["normal"])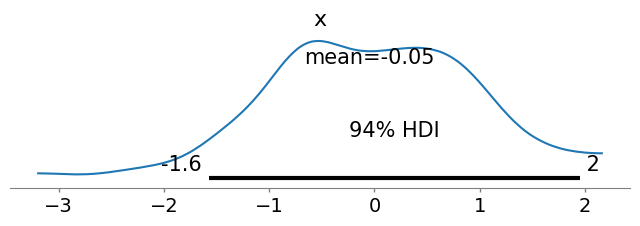
PyMC integration
InferenceData
From https://
The object returned by most PyMC sampling methods is arviz.InferenceData.
# 8 school examples
# - there are 8 schools (each with a name)
# -

J = 8
# Observations.
# - Mean (unknown).
y = np.array([28.0, 8.0, -3.0, 7.0, -1.0, 1.0, 18.0, 12.0])
# - Std dev (is known).
sigma = np.array([15.0, 10.0, 16.0, 11.0, 9.0, 11.0, 10.0, 18.0])

schools = np.array(
    [
        "Choate",
        "Deerfield",
        "Phillips Andover",
        "Phillips Exeter",
        "Hotchkiss",
        "Lawrenceville",
        "St. Paul's",
        "Mt. Hermon",
    ]
)

# with pm.Model() as centered_eight:
#    # 8 normal RVs for the mean.
#    mu = pm.Normal("mu", mu=0, sigma=5)
#    tau = pm.HalfCauchy("tau", beta=5)
#    theta = pm.Normal("theta", mu=mu, sigma=tau, shape=J)
#    # The observed data has:
#    # - random means and
#    # - known std dev.
#    obs = pm.Normal("obs", mu=theta, sigma=sigma, observed=y)
#    # This pattern is useful in PyMC3.
#    #prior = pm.sample_prior_predictive()
#    # Sample the posterior.
#    centered_eight_trace = pm.sample(
#        # Return data as arviz.InferenceData instead of MultiTrace.
#        return_inferencedata=False)
#    posterior_predictive = pm.sample_posterior_predictive(centered_eight_trace)
Auto-assigning NUTS sampler...
Initializing NUTS using jitter+adapt_diag...
Multiprocess sampling (2 chains in 2 jobs)
NUTS: [mu, tau, theta]
Sampling 2 chains for 1_000 tune and 1_000 draw iterations (2_000 + 2_000 draws total) took 2 seconds.
We recommend running at least 4 chains for robust computation of convergence diagnostics
Sampling: [obs]
# pm.model_to_graphviz(centered_eight)- Most ArviZ functions accept
traceobjects. - It can be converted into
InferenceData
# print(type(centered_eight))
# print(centered_eight)
# print(type(centered_eight_trace))
# print(centered_eight_trace)with pm.Model(coords={"school": schools}) as centered_eight:
mu = pm.Normal("mu", mu=0, sigma=5)
tau = pm.HalfCauchy("tau", beta=5)
theta = pm.Normal("theta", mu=mu, sigma=tau, dims="school")
pm.Normal("obs", mu=theta, sigma=sigma, observed=y, dims="school")
# This pattern can be useful in PyMC
idata = pm.sample_prior_predictive()
idata.extend(pm.sample())
pm.sample_posterior_predictive(idata, extend_inferencedata=True)Sampling: [mu, obs, tau, theta]
Auto-assigning NUTS sampler...
Initializing NUTS using jitter+adapt_diag...
Multiprocess sampling (2 chains in 2 jobs)
NUTS: [mu, tau, theta]
Sampling 2 chains for 1_000 tune and 1_000 draw iterations (2_000 + 2_000 draws total) took 2 seconds.
We recommend running at least 4 chains for robust computation of convergence diagnostics
Sampling: [obs]
idataaz.plot_autocorr(centered_eight_trace)---------------------------------------------------------------------------
ValueError Traceback (most recent call last)
Cell In[36], line 1
----> 1 az.plot_autocorr(centered_eight_trace);
File /venv/lib/python3.9/site-packages/arviz/plots/autocorrplot.py:119, in plot_autocorr(data, var_names, filter_vars, max_lag, combined, grid, figsize, textsize, labeller, ax, backend, backend_config, backend_kwargs, show)
10 def plot_autocorr(
11 data,
12 var_names=None,
(...)
24 show=None,
25 ):
26 r"""Bar plot of the autocorrelation function (ACF) for a sequence of data.
27
28 The ACF plots are helpful as a convergence diagnostic for posteriors from MCMC
(...)
117 >>> az.plot_autocorr(data, var_names=['mu', 'tau'], max_lag=200, combined=True)
118 """
--> 119 data = convert_to_dataset(data, group="posterior")
120 var_names = _var_names(var_names, data, filter_vars)
122 # Default max lag to 100 or max length of chain
File /venv/lib/python3.9/site-packages/arviz/data/converters.py:176, in convert_to_dataset(obj, group, coords, dims)
138 def convert_to_dataset(obj, *, group="posterior", coords=None, dims=None):
139 """Convert a supported object to an xarray dataset.
140
141 This function is idempotent, in that it will return xarray.Dataset functions
(...)
174 xarray.Dataset
175 """
--> 176 inference_data = convert_to_inference_data(obj, group=group, coords=coords, dims=dims)
177 dataset = getattr(inference_data, group, None)
178 if dataset is None:
File /venv/lib/python3.9/site-packages/arviz/data/converters.py:130, in convert_to_inference_data(obj, group, coords, dims, **kwargs)
116 else:
117 allowable_types = (
118 "xarray dataarray",
119 "xarray dataset",
(...)
128 "cmdstanpy fit",
129 )
--> 130 raise ValueError(
131 f'Can only convert {", ".join(allowable_types)} to InferenceData, '
132 f"not {obj.__class__.__name__}"
133 )
135 return InferenceData(**{group: dataset})
ValueError: Can only convert xarray dataarray, xarray dataset, dict, netcdf filename, numpy array, pystan fit, emcee fit, pyro mcmc fit, numpyro mcmc fit, cmdstan fit csv filename, cmdstanpy fit to InferenceData, not MultiTrace# Build the inference data from PyMC3 run.
data = az.from_pymc(
trace=centered_eight_trace,
prior=prior,
posterior_predictive=posterior_predictive,
model=centered_eight,
coords={"school": schools},
dims={"theta": ["school"], "obs": ["school"]},
)
data---------------------------------------------------------------------------
AttributeError Traceback (most recent call last)
Cell In[38], line 2
1 # Build the inference data from PyMC3 run.
----> 2 data = az.from_pymc(
3 trace=centered_eight_trace,
4 prior=prior,
5 posterior_predictive=posterior_predictive,
6 model=centered_eight,
7 coords={"school": schools},
8 dims={"theta": ["school"], "obs": ["school"]},
9 )
10 data
AttributeError: module 'arviz' has no attribute 'from_pymc'Introduction to xarray, InferenceData, netCDF
https://
There are several data structures that ArviZ relies on:
- NumPy arrays
- xarray.Dataset
- arviz.InferenceData
- netCDF
Bayesian inference generates numerous datasets:
- Prior / posterior distribution for N variables
- Observed data
- Prior / posterior predictive distribution
- Trace data for each inference run
- Sample statistics for each inference run
Data from probabilistic programming is high-dimensional
- Use
xarrayto store high-dimensional data with human readable dimensions and coordinates
Different Bayesian modeling libraries (e.g., PyMC3, Pyro, PyStan) generate data in different formats
print(az.list_datasets()[:1000])centered_eight
==============
A centered parameterization of the eight schools model. Provided as an example of a model that NUTS has trouble fitting. Compare to `non_centered_eight`.
The eight schools model is a hierarchical model used for an analysis of the effectiveness of classes that were designed to improve students' performance on the Scholastic Aptitude Test.
See Bayesian Data Analysis (Gelman et. al.) for more details.
local: /venv/lib/python3.12/site-packages/arviz/data/example_data/data/centered_eight.nc
----------
non_centered_eight
==================
A non-centered parameterization of the eight schools model. This is a hierarchical model where sampling problems may be fixed by a non-centered parametrization. Compare to `centered_eight`.
The eight schools model is a hierarchical model used for an analysis of the effectiveness of classes that were designed to improve students' performance on the Scholastic Aptitude Test.
See Bayesian Data Analysis (Gelman et. al.) for
# From Bayesian Data Analysis, section 5.5 (Gelman et al. 2013):

# Analyze the effects of special coaching programs for SAT-V (Scholastic Aptitude Test-Verbal) in each of eight high schools.
# - The outcome variable in each study was the score on a special administration of the SAT-V
# - the scores can vary between 200 and 800, with mean about 500 and standard deviation about 100
data = az.load_arviz_data("centered_eight")
dataThere are multiple datasets (e.g., posterior, prior, observed data)
Each dataset is a
xarray.Dataset- There are 8 schools
- There are 3 variables (mu, theta, tau)
- 4 chains
- Each chain has 500 draws
Each dataset has different sizes, so we can’t store them in a single xarray
# Print prior.
data.prior# Print one dataset.
data.observed_datanetCDF
arviz.InferenceDataandxarray.Datasetstore data in memory- netCDF is a standard for serializing array oriented files
- netCDF corresponds to a
arviz.InferenceData
- netCDF corresponds to a
Creating InferenceData
https://
arviz.InferenceDatais the central format of Arviz- It is a container that maintains references to one or more
xarray.Dataset
# Build from 1D numpy array
size = 100
data = np.random.randn(size)
dataset = az.convert_to_inference_data(data)
dataset# Build from nD numpy array
shape = (1, 2, 3, 4, 5)
data = np.random.randn(*shape)
print("data.shape=", data.shape)
dataset = az.convert_to_inference_data(data)
datasetdata.shape= (1, 2, 3, 4, 5)
The 5 dimensions are interpreted as “chain”, “draw” and the rests are dimensions of the data
InferenceData can also be built from dictionary and pd.DataFrame
# Build from PyMC.

import pymc as pm

draws = 500
chains = 2
data = {
    "J": 8,
    "y": np.array([28.0, 8.0, -3.0, 7.0, -1.0, 1.0, 18.0, 12.0]),
    "sigma": np.array([15.0, 10.0, 16.0, 11.0, 9.0, 11.0, 10.0, 18.0]),
}

with pm.Model() as model:
    mu = pm.Normal("mu", mu=0, sigma=5)
    tau = pm.HalfCauchy("tau", beta=5)
    theta_tilde = pm.Normal("theta_tilde", mu=0, sigma=1, shape=data["J"])
    theta = pm.Deterministic("theta", mu + tau * theta_tilde)
    pm.Normal("obs", mu=theta, sigma=data["sigma"], observed=data["y"])
    #
    idata = pm.sample(draws, chains=chains)
    pm.sample_posterior_predictive(idata, extend_inferencedata=True)
    # prior = pm.sample_prior_predictive()
    # posterior_predictive = pm.sample_posterior_predictive(trace)

    # pm_data = az.from_pymc3(
    #     trace=trace,
    #     prior=prior,
    #     posterior_predictive=posterior_predictive,
    #     coords={"school": np.arange(data["J"])},
    #     dims={"theta": ["school"], "theta_tilde": ["school"]})
Auto-assigning NUTS sampler...
Initializing NUTS using jitter+adapt_diag...
Multiprocess sampling (2 chains in 2 jobs)
NUTS: [mu, tau, theta_tilde]
Sampling 2 chains for 1_000 tune and 500 draw iterations (2_000 + 1_000 draws total) took 1 seconds.
We recommend running at least 4 chains for robust computation of convergence diagnostics
The rhat statistic is larger than 1.01 for some parameters. This indicates problems during sampling. See https://arxiv.org/abs/1903.08008 for details
Sampling: [obs]
idataWorking with InferenceData
https://
# Combine chains and draws.
stacked = az.extract(idata)
stacked# Extract a NumPy array for a param.
stacked.mu.values[:10]array([ 5.85416171, 4.56964056, 3.06585315, 4.5206111 , 5.4921385 ,
5.67251551, 1.52179431, 1.40516149, 11.3686218 , -3.14945078])idata.observed_dataExample gallery
User guide
InferenceData schema
https://