Imports
%load_ext autoreload
%autoreload 2

import logging

import matplotlib.pyplot as plt
import networkx as nx
import pgmpy.base as pgmpy_base
import seaborn as sns

# Set plotting style.
# TODO(gp): Is this needed?
sns.set_style("whitegrid")
plt.rcParams["figure.figsize"] = (12, 6)
import helpers.hintrospection as hintros
import helpers.htutorial as ut
import L08_04_02_causal_inference_utils as mtl0cireout
ut.config_notebook()
# Initialize logger.
logging.basicConfig(level=logging.INFO)
_LOG = logging.getLogger(__name__)Module 'networkx' is already installed.
Module 'pgmpy' is already installed.
Part 1: Causal Roles
Cell 1.1: Exploring causal roles in a DAG
Goal:
- Visualize which nodes in a DAG play the role of confounder, mediator, or collider relative to a selected treatment-outcome pair
- Build intuition for how graph structure determines causal relationships
Implementation: mtl0cireout.cell1_causal_roles_explorer()
_classify_causal_roles()labels each node as a confounder (common ancestor of treatment and outcome), mediator (on a directed path from treatment to outcome), or collider (both path-neighbors point into it)_plot_causal_roles()colors the DAG: treatment green, outcome blue, confounders orange, mediators purple, colliders red, other light blue
hintros.print_obj_info(mtl0cireout.cell1_causal_roles_explorer)pymc is not installed
arviz is not installed
preliz is not installed
sns is not installed
Python 3.12.13
Linux 38584b25ad22 6.12.67-linuxkit #1 SMP Sun Jan 25 02:26:28 UTC 2026 aarch64 GNU/Linux
Usage
Inputs
Graph: select a predefined causal graph (Confounder, Mediator, Collider, etc.)Treatment: the treatment nodeOutcome: the outcome nodeShow: redraw the DAG for the current selection
Panels
- the DAG, color-coded by causal role, with a legend naming the confounders/mediators/colliders for the current treatment-outcome pair
mtl0cireout.cell1_causal_roles_explorer()Loading...
Guided usage
- Select the
Collidergraph, withTreatment=X,Outcome=Y- Observe
Cis colored red: it is a collider, since bothXandYpoint into it
- Observe
- Switch to the
Confounder + Mediatorgraph- Observe
Zis orange (confounder ofX,Y) andMis purple (mediator on theX-Ypath): the same graph position can carry different roles depending on the treatment-outcome pair chosen
- Observe
Part 2: D-Separation Basics
Cell 2.1: Building and visualizing a DAG
Goal:
- Build a specific DAG to use as a running example for querying d-separation properties by hand
Implementation: mtl0cireout.plot_graph_highlight(model)
model = nx.DiGraph(
    [
        ("C", "A"),
        ("C", "B"),
        ("D", "A"),
        ("B", "E"),
        ("F", "E"),
        ("A", "G"),
    ]
)

mtl0cireout.plot_graph_highlight(model)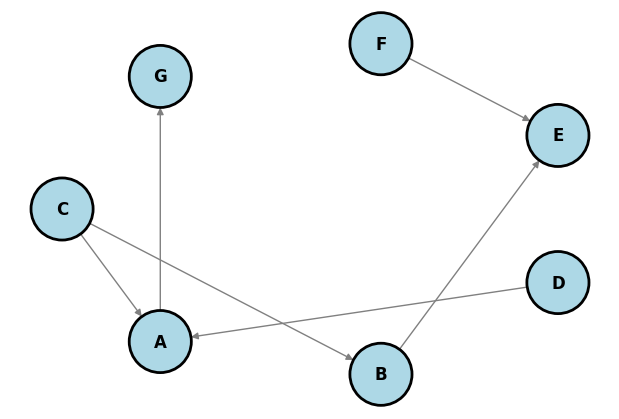
Cell 2.2: Querying d-separation with pgmpy
Goal:
- Demonstrate how conditioning on a node can open or close paths between
2 other nodes, by querying
pgmpy’s exact d-separation check
Implementation: dag.is_dconnected(node1, node2, observed=...)
DandCare connected only through the colliderD -> A <- G: unobserved, the collider blocks the path; observingA, or its descendantG, opens itGandDare connected only through the chainD -> A -> G: open whenAis unobserved, blocked onceAis observedGandFare connected only through the pathG-A-C-B-E-F, which needs the colliderEto be observed (andA,C,Bto stay unobserved) to become active
# Convert the NetworkX graph to a pgmpy DAG.
dag = pgmpy_base.DAG(model.edges())
Are D and C dependent?
True
# `dag.is_dconnected()` already returns True when the 2 nodes are
# d-connected (dependent), so it is read directly, with no negation.
print("D, C dependent (unconditional):", dag.is_dconnected("D", "C"))
print("D, C dependent (given A):", dag.is_dconnected("D", "C", observed={"A"}))
print("D, C dependent (given G):", dag.is_dconnected("D", "C", observed={"G"}))
print("G, D dependent (unconditional):", dag.is_dconnected("G", "D"))
print("G, D dependent (given A):", dag.is_dconnected("G", "D", observed=["A"]))
print("G, F dependent (unconditional):", dag.is_dconnected("G", "F"))
print("G, F dependent (given E):", dag.is_dconnected("G", "F", observed=["E"]))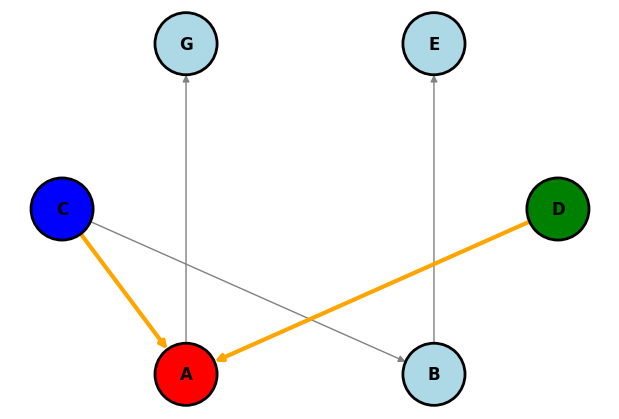
Part 3: Interactive D-Separation Explorer
Cell 3.1: Exploring d-separation interactively
Goal:
- Interactively explore d-separation for any pair of nodes in the DAG built in Part 2
- See how adding nodes to the conditioning set opens or closes paths
Implementation: mtl0cireout.cell3_d_separation_explorer(model, dag)
- Plots the reachable subgraph containing the selected nodes and their
descendants, then reports
dag.is_dconnected()for the current selection
hintros.print_obj_info(mtl0cireout.cell3_d_separation_explorer)Are D and C dependent given A?
False
Usage
Inputs
Node 1: first node to queryNode 2: second node to queryConditioning: set of nodes to condition on (shift-click to select multiple)Run: recompute the plot and the d-separation result
Panels
- the reachable subgraph, with node1 green, node2 blue, conditioning nodes red, and paths between node1 and node2 highlighted in orange
- a printed line reporting whether node1/node2 are dependent given the current conditioning set
mtl0cireout.cell3_d_separation_explorer(
    model,
    dag,
)
Loading...
Guided usage
- Set
Node 1=D,Node 2=C, with no conditioning- Observe they are reported as not dependent: the path is blocked at
the unobserved collider
A
- Observe they are reported as not dependent: the path is blocked at
the unobserved collider
- Add
AtoConditioning- Observe they become dependent: conditioning on a collider between 2 nodes opens a previously closed path
- Set
Node 1=G,Node 2=D, withAinConditioning- Observe they become independent: conditioning on the mediator
Ablocks the causal path fromDtoG
- Observe they become independent: conditioning on the mediator