Imports
%load_ext autoreload
%autoreload 2

!sudo /bin/bash -c "(source /venv/bin/activate; pip install --quiet graphviz)"

import pandas as pd
import pymc as pm
import numpy as np
import seaborn as sns
from IPython.display import display
import helpers.htutorial as ut
import L07_03_hierarchical_models_utils as putils
ut.config_notebook()
dir_name = "./L07_data"
!ls $dir_namePart 1: Group Comparison
Cell 1.1: Loading and visualizing the tips data
Goal:
- Look at how tip amount varies by day, before fitting a model that estimates one mean tip per day
tips = pd.read_csv(dir_name + "/tips.csv")
display(tips)
_ = sns.boxplot(x="day", y="tip", data=tips)Cell 1.2: Extracting the tip values
Goal:
- Pull the raw tip amounts out as the array the model will observe
tip = tips["tip"].values
print("tip[:10]=", tip[:10])
Cell 1.3: Building the day-group index
Goal:
- Turn the categorical
daycolumn into an integer group index, so the model can look up each observation’s group by position
# Create a vector going from day to group idx.
idx = pd.Categorical(tips["day"]).codes
print("idx=", idx)

# Count the groups.
groups = np.unique(idx)
n_groups = len(groups)
print("n_groups=", n_groups, "groups=", groups)
WARNING (pytensor.tensor.blas): Using NumPy C-API based implementation for BLAS functions.
Cell 1.4: Fitting a vectorized group-comparison model
Goal:
- Fit one Normal per day, all at once via vectorized indexing instead of a Python for-loop over groups
Implementation:
mu/sigmaare length-n_groupsvectors;y ~ Normal(mu[idx], sigma[idx])looks up each observation’s own group’s parameters
# The model is the same as before but it can be easily vectorized.
# There is no need to write a for-loop.
with pm.Model() as comparing_groups:
    # mu is a vector of n_groups elements.
    mu = pm.Normal("mu", mu=0, sigma=10, shape=n_groups)
    # sigma is a vector of n_groups elements.
    sigma = pm.HalfNormal("sigma", sigma=10, shape=n_groups)
    # y is a vector of Normals, each with the mean and sigma of its group.
    y = pm.Normal("y", mu=mu[idx], sigma=sigma[idx], observed=tip)
    idata_cg = pm.sample(5000)
Part 2: Hierarchical Models
Cell 2.1: Loading the chemical-shift data
Goal:
- Load per-amino-acid chemical-shift measurements, with both a theoretical and an experimental value per row
cs_data = pd.read_csv(dir_name + "/chemical_shifts_theo_exp.csv")
cs_data["diff"] = cs_data["theo"] - cs_data["exp"]
display(cs_data)
Loading...
Cell 2.2: Computing the theory-experiment difference
Goal:
- Extract the theory-minus-experiment difference the models below will treat as the observed quantity
diff = cs_data.theo.values - cs_data.exp.values
print("diff=", diff)
Cell 2.3: Encoding the amino-acid groups
Goal:
- Turn the categorical amino-acid column into an integer group index and
a
coordsmapping, so PyMC can label each group by name
# Array of categorical values.
cat_encode = pd.Categorical(cs_data["aa"])
print("cat_encode=", cat_encode)
idx = cat_encode.codes
print("idx=", len(idx), idx)
coords = {"aa": cat_encode.categories}
print("coords=", coords)
diff= [ 2.91 0.77 -0.49 ... 0.57 1.12 -2.48]
cat_encode= ['ILE', 'TYR', 'SER', 'ALA', 'ARG', ..., 'LYS', 'ARG', 'LYS', 'GLU', 'SER']
Length: 1776
Categories (19, object): ['ALA', 'ARG', 'ASN', 'ASP', ..., 'THR', 'TRP', 'TYR', 'VAL']
idx= 1776 [ 8 17 14 ... 10 5 14]
coords= {'aa': Index(['ALA', 'ARG', 'ASN', 'ASP', 'GLN', 'GLU', 'GLY', 'HIS', 'ILE', 'LEU',
'LYS', 'MET', 'PHE', 'PRO', 'SER', 'THR', 'TRP', 'TYR', 'VAL'],
dtype='object')}
Cell 2.4: Fitting a non-hierarchical model
Goal:
- Fit one independent
mu/sigmaprior per amino-acid group, with no information shared across groups
Implementation:
mu,sigma ~ Normal(0, 10)/HalfNormal(10), one peraagroup
# Non-hierarchical model.
with pm.Model(coords=coords) as cs_nh:
    # One separate prior for each group.
    mu = pm.Normal("mu", mu=0, sigma=10, dims="aa")
    sigma = pm.HalfNormal("sigma", sigma=10, dims="aa")
    # Likelihood.
    y = pm.Normal("y", mu=mu[idx], sigma=sigma[idx], observed=diff)
    idata_cs_nh = pm.sample()
Auto-assigning NUTS sampler...
Initializing NUTS using jitter+adapt_diag...
Multiprocess sampling (4 chains in 4 jobs)
NUTS: [mu, sigma]
Loading...
Loading...
Sampling 4 chains for 1_000 tune and 1_000 draw iterations (4_000 + 4_000 draws total) took 2 seconds.
pm.model_to_graphviz(cs_nh)Loading...
Cell 2.5: Fitting a hierarchical model
Goal:
- Refit the same data letting every group’s
mushare information through a common hyper-prior, instead of being estimated independently
Implementation:
mu_mu,mu_sigmaare hyper-priors shared across groups; each group’smu ~ Normal(mu_mu, mu_sigma)
with pm.Model(coords=coords) as cs_h:
    # Hyper-priors.
    mu_mu = pm.Normal("mu_mu", mu=0, sigma=10)
    mu_sigma = pm.HalfNormal("mu_sigma", sigma=10)

    # Priors.
    mu = pm.Normal("mu", mu=mu_mu, sigma=mu_sigma, dims="aa")
    sigma = pm.HalfNormal("sigma", sigma=10, dims="aa")

    # Likelihood (same as before).
    y = pm.Normal("y", mu=mu[idx], sigma=sigma[idx], observed=diff)
    idata_cs_h = pm.sample()
Auto-assigning NUTS sampler...
Initializing NUTS using jitter+adapt_diag...
Multiprocess sampling (4 chains in 4 jobs)
NUTS: [mu_mu, mu_sigma, mu, sigma]
Loading...
Loading...
Sampling 4 chains for 1_000 tune and 1_000 draw iterations (4_000 + 4_000 draws total) took 2 seconds.
pm.model_to_graphviz(cs_h)Loading...
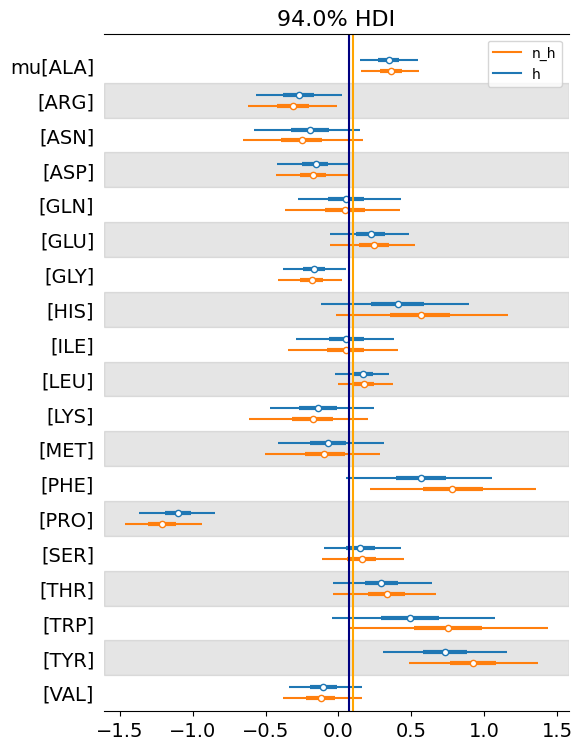
Cell 2.6: Comparing hierarchical vs non-hierarchical estimates
Goal:
- Compare the two models’ credible intervals for every group’s
muon one forest plot, to see how much the hierarchical prior pulls estimates toward the global mean
Implementation: putils.plot_group_comparison_forest(idata_h, idata_nh)
- Plots both models’ 94% credible intervals via
az.plot_forest(), plus vertical lines for each model’s global mean
putils.plot_group_comparison_forest(idata_cs_h, idata_cs_nh)