Categorical Data
Table of Contents
import numpy as np
import pandas as pd
Categorical Data
Background
- A column in a table can contain repeated instances of a smaller set of distinct values
- Categorical data used in df and series can lead to increase in performance and reduction in memory
values = pd.Series(["apple", "orange", "apple", "apple"] * 2)
values
0 apple
1 orange
2 apple
3 apple
4 apple
5 orange
6 apple
7 apple
dtype: objectpd.unique(values)array(['apple', 'orange'], dtype=object)pd.value_counts(values)apple 6
orange 2
dtype: int64# We can represent categorical data more efficiently with "dictionary-encoded"
# representations.
# categories = levels
values = pd.Series([0, 1, 0, 0] * 2)
dim = pd.Series(["apple", "orange"])
dim.take(values)0 apple
1 orange
0 apple
0 apple
0 apple
1 orange
0 apple
0 apple
dtype: objectCategorical type in pandas
fruits = ["apple", "orange", "apple", "apple"] * 2

N = len(fruits)

# Note that the order of the columns relies on the dictionary being evaluated
# by sorted key.
df = pd.DataFrame(
    {
        "fruit": fruits,
        "basket_id": np.arange(N),
        "count": np.random.randint(3, 15, size=N),
        "weight": np.random.uniform(0, 4, size=N),
    },
    columns="basket_id fruit count weight".split(),
)

df
Loading...
# The columns is an array of string objects.
df["fruit"]
0 apple
1 orange
2 apple
3 apple
4 apple
5 orange
6 apple
7 apple
Name: fruit, dtype: objectfruit_col = df["fruit"]
print("fruit_col.values=", fruit_col.values)
print("type(fruit_col.values)=", type(fruit_col.values))
print("fruit_col.values[0]=", type(fruit_col.values[0]), fruit_col.values[0])fruit_col.values= ['apple' 'orange' 'apple' 'apple' 'apple' 'orange' 'apple' 'apple']
type(fruit_col.values)= <type 'numpy.ndarray'>
fruit_col.values[0]= <type 'str'> apple
# Convert into a category.
fruit_cat = df["fruit"].astype("category")
fruit_cat
0 apple
1 orange
2 apple
3 apple
4 apple
5 orange
6 apple
7 apple
Name: fruit, dtype: category
Categories (2, object): [apple, orange]fruit_col = fruit_cat
print("fruit_col.values=", fruit_col.values)
print("type(fruit_col.values)=", type(fruit_col.values))
print("fruit_col.values[0]=", type(fruit_col.values[0]), fruit_col.values[0])fruit_col.values= [apple, orange, apple, apple, apple, orange, apple, apple]
Categories (2, object): [apple, orange]
type(fruit_col.values)= <class 'pandas.core.categorical.Categorical'>
fruit_col.values[0]= <type 'str'> apple
# Show the encoding.
c = fruit_cat.values

print(c.categories)
print(c.codes)
Index([u'apple', u'orange'], dtype='object')
[0 1 0 0 0 1 0 0]
# Create categorical data from other sequences.

my_categories = pd.Categorical("foo bar baz foo bar".split())

my_categories
[foo, bar, baz, foo, bar]
Categories (3, object): [bar, baz, foo]# Create categorical data from categories and codes.
categories = "foo bar baz".split()
codes = [0, 1, 2, 0, 0, 1]
my_cats_2 = pd.Categorical.from_codes(codes, categories)
my_cats_2[foo, bar, baz, foo, foo, bar]
Categories (3, object): [foo, bar, baz]# We can indicate that categories have a meaningful ordering.
ordered_cat = pd.Categorical.from_codes(codes, categories, ordered=True)
ordered_cat[foo, bar, baz, foo, foo, bar]
Categories (3, object): [foo < bar < baz]Computations with Categoricals
np.random.seed(12345)

draws = np.random.randn(1000)

draws[:5]
array([-0.20470766, 0.47894334, -0.51943872, -0.5557303 , 1.96578057])pd.Series(draws).hist()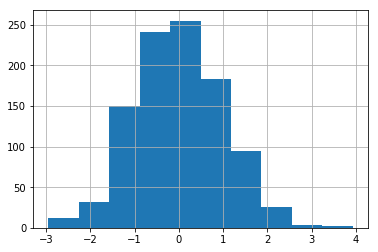
# Split in 4 bins using quantiles.
bins = pd.qcut(draws, 4)
bins
[(-0.684, -0.0101], (-0.0101, 0.63], (-0.684, -0.0101], (-0.684, -0.0101], (0.63, 3.928], ..., (-0.0101, 0.63], (-0.684, -0.0101], (-2.95, -0.684], (-0.0101, 0.63], (0.63, 3.928]]
Length: 1000
Categories (4, interval[float64]): [(-2.95, -0.684] < (-0.684, -0.0101] < (-0.0101, 0.63] < (0.63, 3.928]]x = pd.Series(sorted([x.mid for x in bins.get_values()])).unique()
x = pd.Series(x)
x.plot(marker="o")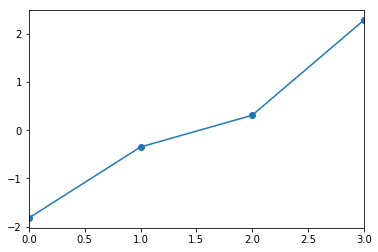
# Assign labels to the quantiles.
bins = pd.qcut(draws, 4, labels="Q1 Q2 Q3 Q4".split())
bins
[Q2, Q3, Q2, Q2, Q4, ..., Q3, Q2, Q1, Q3, Q4]
Length: 1000
Categories (4, object): [Q1 < Q2 < Q3 < Q4]bins.codes[:10]array([1, 2, 1, 1, 3, 3, 2, 2, 3, 3], dtype=int8)srs = pd.Series(bins, name="quartile")
srs.head()0 Q2
1 Q3
2 Q2
3 Q2
4 Q4
Name: quartile, dtype: category
Categories (4, object): [Q1 < Q2 < Q3 < Q4]# We can use the bins to groupby.
results = pd.Series(srs).groupby(bins).agg(["count", "min", max]).reset_index()
resultsLoading...
# The column retains categorical information.
results["index"]
0 Q1
1 Q2
2 Q3
3 Q4
Name: index, dtype: category
Categories (4, object): [Q1 < Q2 < Q3 < Q4]Categorical methods
s = pd.Series("a b c d".split() * 2)

cat_s = s.astype("category")
cat_s
0 a
1 b
2 c
3 d
4 a
5 b
6 c
7 d
dtype: category
Categories (4, object): [a, b, c, d]# Use .cat to access categorical methods.
cat_s.cat.codes0 0
1 1
2 2
3 3
4 0
5 1
6 2
7 3
dtype: int8cat_s.cat.categoriesIndex([u'a', u'b', u'c', u'd'], dtype='object')# .set_categories() allows to increase the number of possible categories.
# .remove_unused_categories()Creating dummy variables for modeling
- Often in statistics or ML one transforms categorical data into dummy vars, aka one-hot encoding
cat_s = pd.Series("a b c d".split() * 2, dtype="category")

cat_s
0 a
1 b
2 c
3 d
4 a
5 b
6 c
7 d
dtype: category
Categories (4, object): [a, b, c, d]pd.get_dummies(cat_s)Loading...
Advanced GroupBy use
Transform
- apply() is applied to grouped operations
- transform() is similar to apply() but imposes more constraints
- it can produce a scalar value to be broadcasted to the shape of the group
- it can produce an object of the same shape of the group
- it must not mutate its input
df = pd.DataFrame({"key": "a b c".split() * 4, "value": np.arange(12.0)})

df
Loading...
g = df.groupby("key").value

g.mean()
key
a 4.5
b 5.5
c 6.5
Name: value, dtype: float64# If we want to produce a series with the same shape, but with values replaced
# by average grouped by 'key'.
# g.transform('mean')
g.transform(lambda x: x.mean())0 4.5
1 5.5
2 6.5
3 4.5
4 5.5
5 6.5
6 4.5
7 5.5
8 6.5
9 4.5
10 5.5
11 6.5
Name: value, dtype: float64def normalize(x):
return (x - x.mean()) / x.std()
g.transform(normalize)0 -1.161895
1 -1.161895
2 -1.161895
3 -0.387298
4 -0.387298
5 -0.387298
6 0.387298
7 0.387298
8 0.387298
9 1.161895
10 1.161895
11 1.161895
Name: value, dtype: float64Grouped time resampling
- resample() is a group operation based on time intrvalization
n = 15
times = pd.date_range("2017-05-20 00:00", freq="1min", periods=n)

df = pd.DataFrame({"time": times, "value": np.arange(n)})

df
Loading...
df.set_index("time").resample("5min").count()Loading...
df2 = pd.DataFrame(
    {
        "time": times.repeat(3),
        "key": np.tile("a b c".split(), n),
        "value": np.arange(n * 3.0),
    }
)

df2[:7]
Loading...
time_key = pd.TimeGrouper("5min")

resampled = df2.set_index("time").groupby(["key", time_key]).sum()

resampled
Loading...